

Requires: SmartSpice & Smartview
Minimum Versions: SMARTSPICE 3.16.12.R
- .Net 2 port analysis on a passive circuit network.
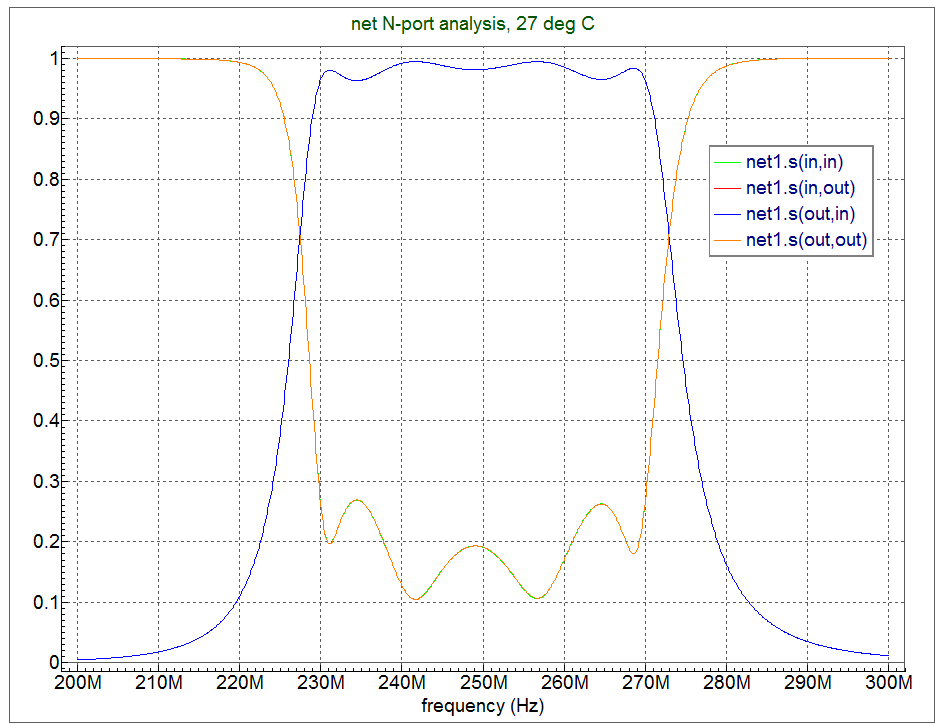
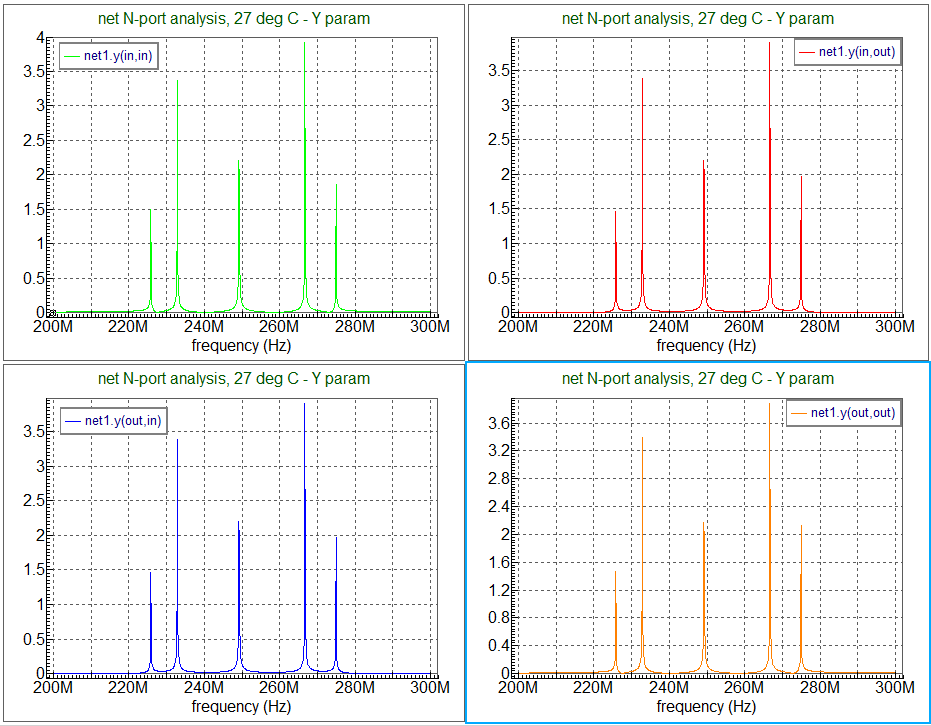
A 2 port network composed of passive elements is analysed with the .NET analysis.
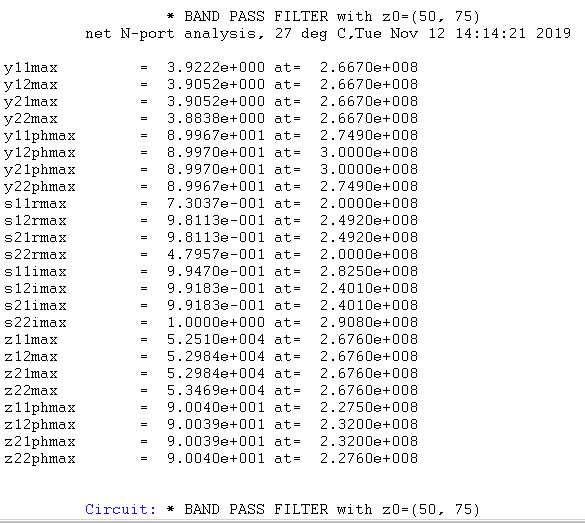
The analysis outputs both S, Y and Z parameter sets to show the frequency response both at the input and the output ports of this circuit.
Graphics


Input Files
Port2_extractS_meas.in
* BAND PASS FILTER with z0=(50, 75)

.options nomod
.option DCSTEP=1

C1   IN 2  3.166pF
L1   2  3  203nH
C2   3  0  3.76pF
C3   3  4  1.75pF
C4   4  0  9.1pF
L2   4  0  36.81nH
C5   4  5  1.07pF
C6   5  0  3.13pF
L3   5  6  233.17nH
C7   6  7  5.92pF
C8   7  0  4.51pF
C9   7  8  1.568pF
C10  8  0  8.866pF
L4   8  0  35.71nH
C11  8  9  2.06pF
C12  9  0  4.3pF
L5   9 10  200.97nH
C13  10 OUT  2.97pF
RX  OUT  0  1.e+14

.AC LIN 1001 200meg 300meg

.NET N=2 IN OUT 0  z0=(50, 75)

.MEASURE NET y11max MAX ym(in,in)
.MEASURE NET y12max MAX ym(in,out)
.MEASURE NET y21max MAX ym(out,in)
.MEASURE NET y22max MAX ym(out,out)

.MEASURE NET y11phmax MAX yp(in,in)
.MEASURE NET y12phmax MAX yp(in,out)
.MEASURE NET y21phmax MAX yp(out,in)
.MEASURE NET y22phmax MAX yp(out,out)

.MEASURE NET s11rmax MAX sr(in,in)
.MEASURE NET s12rmax MAX sr(in,out)
.MEASURE NET s21rmax MAX sr(out,in)
.MEASURE NET s22rmax MAX sr(out,out)

.MEASURE NET s11imax MAX si(in,in)
.MEASURE NET s12imax MAX si(in,out)
.MEASURE NET s21imax MAX si(out,in)
.MEASURE NET s22imax MAX si(out,out)

.MEASURE NET z11max MAX zm(in,in)
.MEASURE NET z12max MAX zm(in,out)
.MEASURE NET z21max MAX zm(out,in)
.MEASURE NET z22max MAX zm(out,out)

.MEASURE NET z11phmax MAX zp(in,in)
.MEASURE NET z12phmax MAX zp(in,out)
.MEASURE NET z21phmax MAX zp(out,in)
.MEASURE NET z22phmax MAX zp(out,out)

.END
Port2_extractS_meas.measure.raw0
Title: * BAND PASS FILTER with z0=(50, 75)
Input deck file name: U:\smartspice_web\analysis\015_net_2_port\Port2_extractS_meas.in
Date: Tue Nov 12 14:14:21 2019
Plotname: Measure Plot
Temperature: 0
Sweepvar: y11max
Sweepmode: 0
Flags: real padded
No. Variables: 24
No. Points: 1
Source: SmartSpice,Platform:0
Version: 4.38.1.R
Variables:	0	y11max	notype
	1	y12max	notype
	2	y21max	notype
	3	y22max	notype
	4	y11phmax	notype
	5	y12phmax	notype
	6	y21phmax	notype
	7	y22phmax	notype
	8	s11rmax	notype
	9	s12rmax	notype
	10	s21rmax	notype
	11	s22rmax	notype
	12	s11imax	notype
	13	s12imax	notype
	14	s21imax	notype
	15	s22imax	notype
	16	z11max	notype
	17	z12max	notype
	18	z21max	notype
	19	z22max	notype
	20	z11phmax	notype
	21	z12phmax	notype
	22	z21phmax	notype
	23	z22phmax	notype
Values:
 0	3.922249997370279e+000
	3.905153197890023e+000
	3.905153197893499e+000
	3.883824311882483e+000
	8.996682828116040e+001
	8.996960364775896e+001
	8.996960357176792e+001
	8.996682819823023e+001
	7.303662512047671e-001
	9.811302638298315e-001
	9.811302638288993e-001
	4.795734177920166e-001
	9.946956391141715e-001
	9.918306943326992e-001
	9.918306942985925e-001
	1.000036163536035e+000
	5.251035580556564e+004
	5.298358100081049e+004
	5.298358100085706e+004
	5.346920984873140e+004
	9.004008309393051e+001
	9.003930573020352e+001
	9.003930563193921e+001
	9.004006558804343e+001