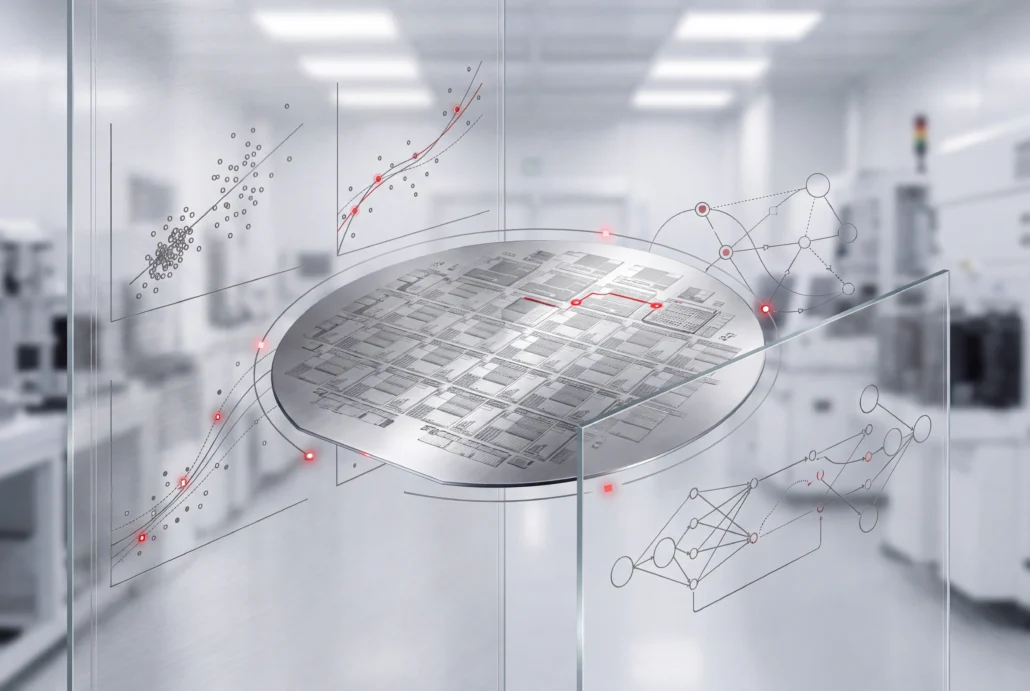
Victory Analytics: machine learning analytics for semiconductor data

Turn simulation runs and fab data into a model you can question, so the answer to a process problem doesn’t wait on a specialist to read the results.

What Victory Analytics does

Victory Analytics is machine learning analytics software that semiconductor teams use in research, development and manufacturing. You bring the data. It cleans and visualizes it, picks the features worth keeping, fits regression and neural-network models, and finds the settings that hit several targets together. Use it on a single module, such as device characterization, a process flow or a fab tool recipe. Or run it across a whole line for yield work: fault detection and classification, and statistical process control on production data.

From raw data to a decision

Data preparation

Flag outliers and fill in missing values before anything gets modeled. Dataset generation picks out categorical variables and duplicated inputs, then decision-forest filtering decides which features the model is allowed to learn from.

Modelling

Run one multivariate analysis that mixes neural networks, decision trees and classical statistics. The neural networks are feed-forward and supervised, with non-linear activation, which lets them fit behavior a polynomial regression misses. For non-linear datasets, Gaussian process regression gives you parameter tuning that keeps the fit between underfitting and overfitting.

Analysis

Rank the inputs that move your outputs with Sobol and decision-forest sensitivity analysis. Multi-level classification handles categorical outcomes. For data that came off a production line, time-series analysis covers seasonality along with AR and MA terms. Model scoring and data-trend analysis tell you how far to trust the fit.

Design of experiments

Generate D-optimal experiment designs by computer, so each run you pay for carries as much information as it can.

Optimisation

Pick a local method, Levenberg-Marquardt or Hooke-Jeeves, or a global one: simulated annealing, parallel tempering, genetic algorithm or differential evolution. The right choice depends on how non-linear the model is and how many inputs and outputs you’re working with. Desirability analysis turns your output targets into a single score, so you optimize for every one of them in one pass.

Automation

Visualization is built in: you inspect the data where you work on it. A Python interface scripts the whole flow end to end, and you’ll want that by the second pass through a training loop.

Where it sits in your flow

Takes in

Output from the Victory TCAD simulators, production data from the fab, measured data, or any mix of the three.

Hands off to

FTCO, where the trained model becomes a surrogate model or digital twin that other engineers can query. Victory DoE, which plans the next round of runs in the training loop and moves the results back in. Utmost IV starts from the same measured data to extract SPICE model parameters.

What you can use it for

Manufacturing processes

Find bottlenecks, tighten quality control and bring costs down.

Device and circuit design optimisation

Widen the operating margin by treating your data systematically.

Product yield improvement

Hold quality to process specifications and target metrics, and make the call on data.

Conference talk

February 2022

How to utilize Victory Analytics and machine learning to calibrate TCAD data

Dr. Stefania Carapezzi, Field Applications Engineer at Silvaco, shows how to calibrate TCAD data with machine learning in Victory Analytics.

Webinar

February 2022

Applying Artificial Intelligence in Fab Technology Co-Optimization (FTCO™)

How the FTCO flow builds a machine learning model of a fabrication step from your fab data and TCAD data, with worked examples.

Product brief · PDF

February 2022

Victory Analytics – Machine Learning-based Analytics Tool

The full capability set in one document you can forward to your team.

Bring the dataset that's stuck

Maybe it’s a DoE that didn’t separate anything, or a model that fits the training set and
nothing else. There’s no download or self-serve trial for Victory Analytics. An application
engineer sets it up on your own data, working through the problem with you.

Victory Analytics questions

What does Victory Analytics do?

It fits statistical and machine learning models to semiconductor data, then shows which inputs matter and where to set them. It works at two scales: one device or process step at a time, or a full production line and its yield.

It draws on four families of methods: neural networks (supervised, feed-forward, non-linear activation), Gaussian process regression, decision trees and forests, and classical multivariate statistics. Sensitivity analysis runs on Sobol indices or decision forests. Optimizers range from local ones such as Levenberg-Marquardt and Hooke-Jeeves to global ones including genetic algorithms and differential evolution.

Not to run it, and not for its factory-level work. Victory Analytics analyzes production and measured data by itself, with no simulation step needed. Adding TCAD simulation output lets the model learn from physics and fab data at the same time.

Yes. Its factory-level applications, fault detection and classification and statistical process control, work directly on production data. Inside FTCO, Victory Analytics trains on simulation and fab data together, so the resulting digital twin reflects both the physics and what your line actually produces.

It's a way to optimize for several outputs at once. Each output gets a score for how close it sits to its ideal value, and those scores combine into one desirability index. The optimizer then has a single number to push up, instead of a trade-off you'd otherwise have to rank by hand.

Yes, through its Python interface, which covers the workflow end to end: loading data, training, scoring and optimizing. Scripting pays off in FTCO work. There you train, run the next set of experiments and train again until the model is ready to serve as a digital twin.

The rest of the TCAD suite

Fab Technology Co-Optimization (FTCO)

The workflow Victory Analytics belongs to, from designed experiments to a digital twin.

Victory DoE

Plans and runs the experiment sets that feed the model.

Victory Visual

Explore TCAD results interactively.

Silvaco TCAD

Process and device simulation that produces the physics side of your data.