Victory Visual

Interactive visualization for Silvaco TCAD results, from full 3D device structures down to the 1D curves you extract from them.

What Victory Visual does

Everything a Silvaco TCAD simulation writes out opens in Victory Visual. A full 3D
structure, a 2D cross-section cut from it and the 1D curves extracted along the way
share one window, so going from the whole device to a single slice doesn’t mean
changing tools. You inspect the simulated device directly, with no export to a third-party viewer first.

One interface to every simulator

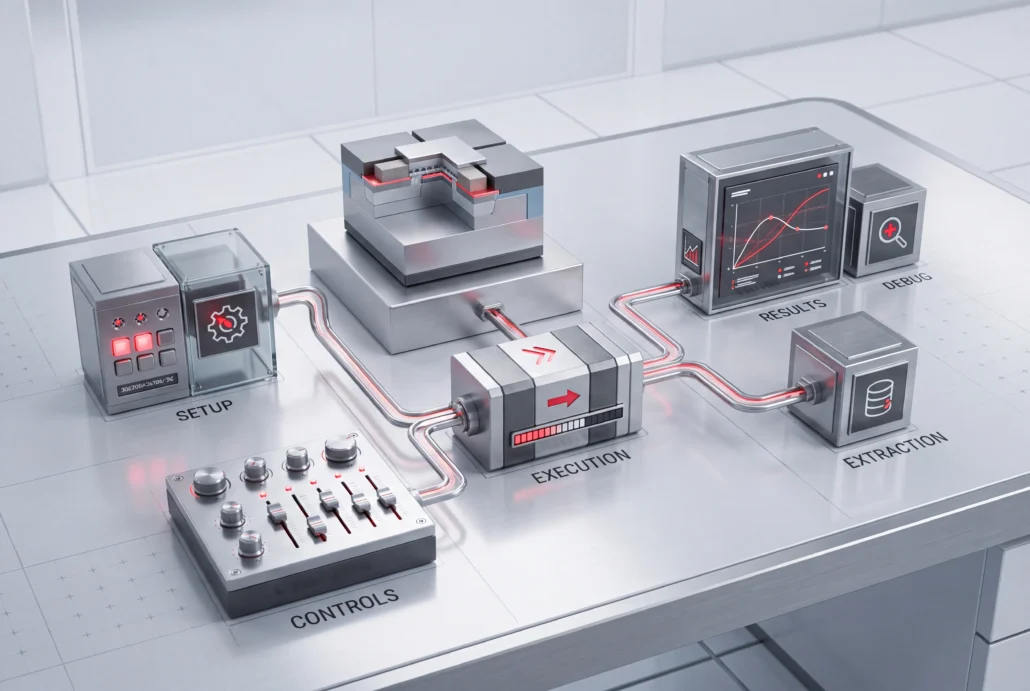
Process, device, meshing, atomistic, extraction — all of them are driven from the same place. You do not learn a different front end for each engine, and a flow that crosses three of them is still one deck in one window.

Debugging, not just editing

Simulation code can be debugged and visualised as it runs, with help to hand and results a click away rather than a directory away. For decks that take hours, seeing the structure form while it is forming is the difference between one run and three.

Scripting at runtime

Variables, loops, if/else statements and file control commands, customisable at run time. This is the part that turns a deck into a program — and the reason the suite, still called Interactive Tools in places, is named by other Silvaco product pages as the thing they are run from.

Inside the suite: the four tools

Four applications, each with its own anchor so you can be sent straight to one.
Three of them do a job here; the fourth has a page of its own.

DeckBuild — the run-time environment

Interactive, GUI-driven development and debugging of simulation decks, with every Silvaco simulator and the visualisation tools integrated into one window. Its extraction language measures process and device parameters — thicknesses, voltages — and produces 1D curves such as IdVd and IdVg; those same extract statements are what fill a Victory DoE result table.

Also: a flow editor that combines individual decks into a hierarchical flow, automated visualisation of structures and extracted curves, a post-processing engine that produces PDF reports and movies of simulation progress, and an integrated Python 3 module for simulator control, custom extract mechanisms and custom GUI components.

What you can do in Victory Visual

Navigate the structure

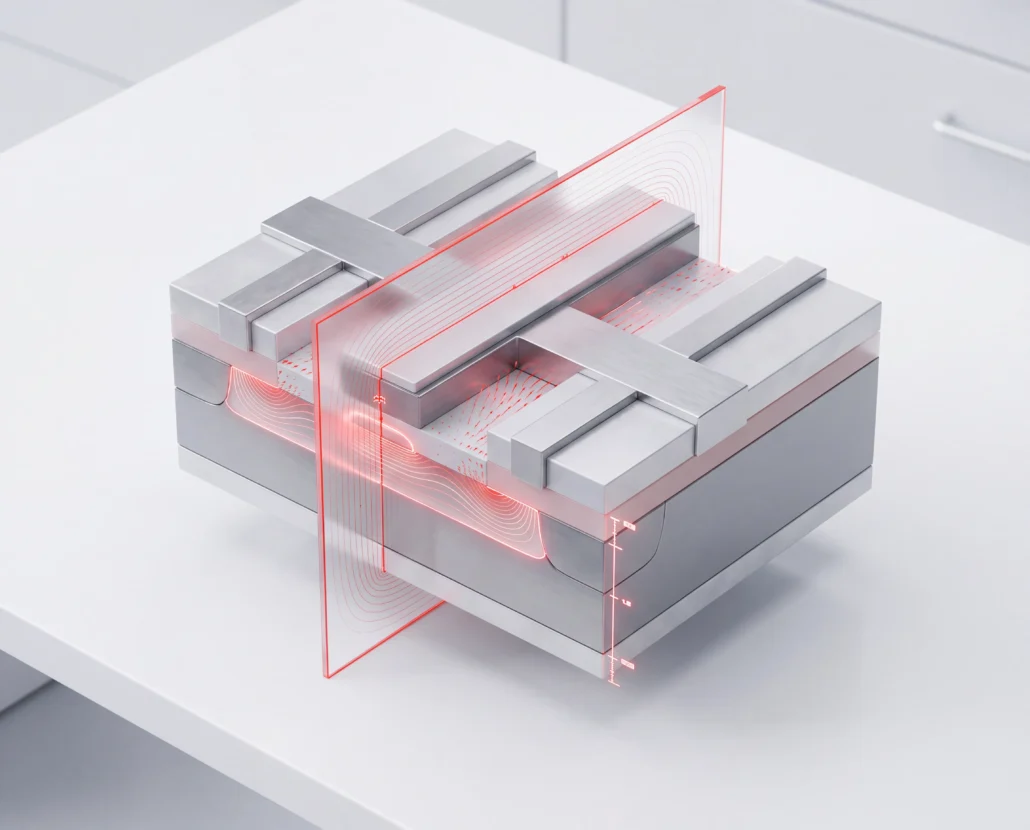
Rotate and zoom with the mouse, and click anywhere inside a 3D structure to read the value at that point. When you need to see inside, the cut-plane tool takes a 2D slice wherever you set it.

Measure and extend

Rulers, probes and other measuring tools let you take exact readings on 1D and 2D structures, and animated markers trace vector quantities through the device. When the number you want isn’t a standard output, write it as a function or macro in the editor and plot it like any 1D quantity. That’s the route to M-plots for OLED devices.

Plot isosurfaces and surface contours for any variable in the solution. Beyond 3D, the viewer covers 2D meshed and 2D contour data, 1D x-y plots, and Smith and polar charts.

Victory DoE — design of experiments

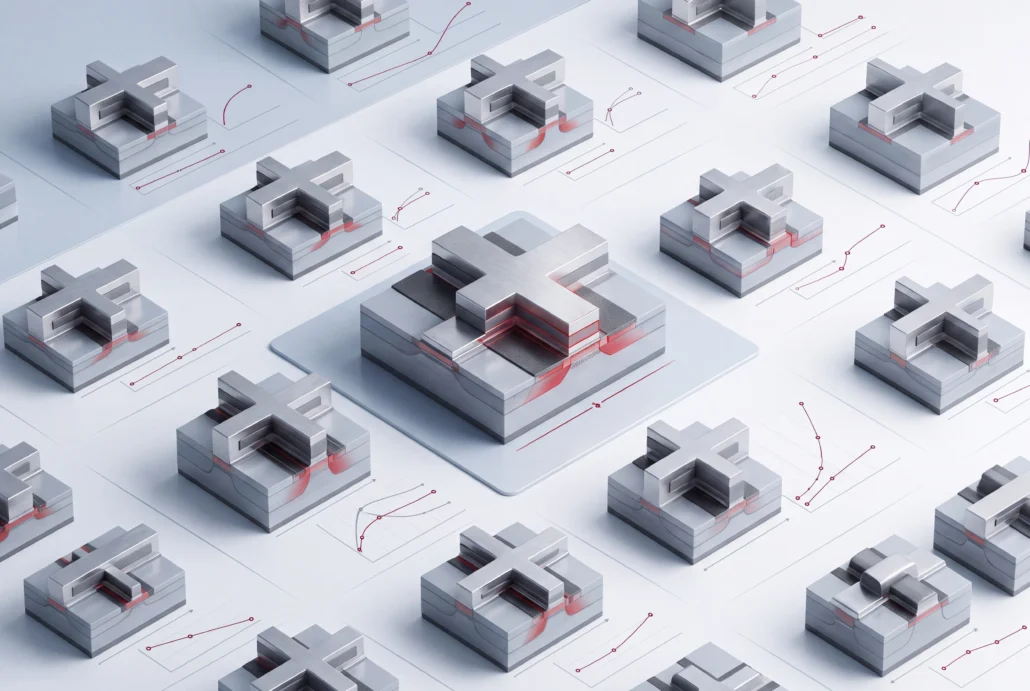
Inside the Lab, Victory DoE is what turns a single deck into a multi-variable experiment: it organises the projects, generates the design-of-experiments table and moves results and data into Victory Analytics for modelling.

It has a page of its own, because it is also an FTCO tool in its own right. Victory DoE in full.

Silver — the material database

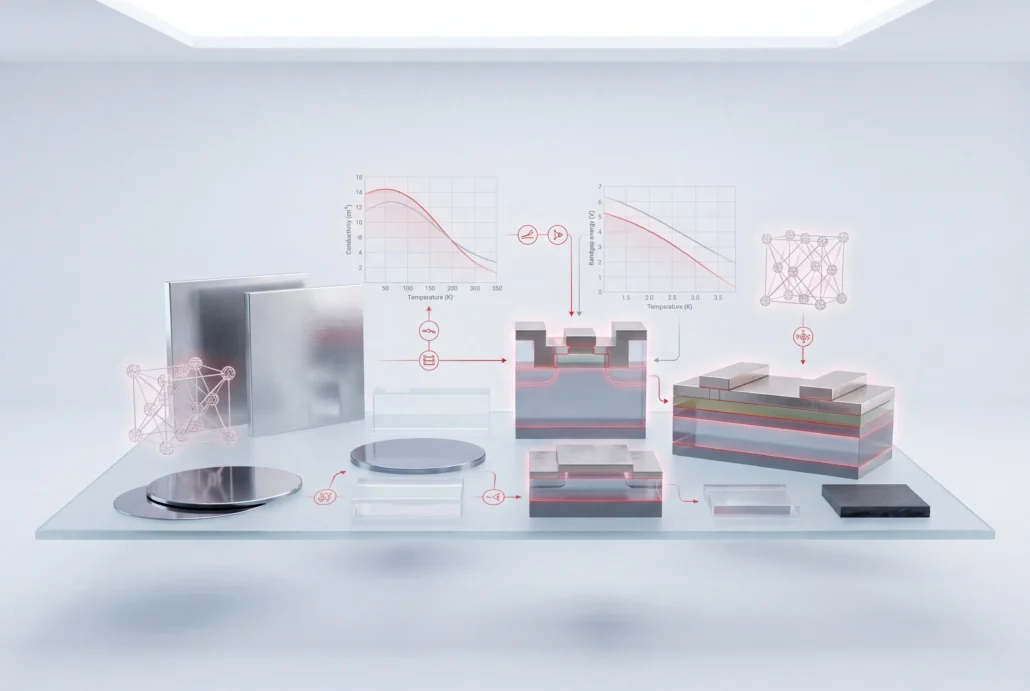
A UI for the Silvaco Material Database (SMDB). Search every process and device parameter for every material, interface and element — which is the alternative to grepping a manual for the name of a coefficient you half remember.

Copy and paste the syntax for adjusting a parameter straight into the deck you are editing, and plot a parameter against temperature to see how it moves before you decide whether it matters.

Works with Silvaco TCAD and FTCO

Runs every Silvaco TCAD simulator

Victory Visual opens results from each Silvaco TCAD simulator: Victory Process, Victory Device, Victory Atomistic, Victory Mesh and Victory RCx 

Hands off to

In the FTCO workflow it sits alongside Victory DoE, which turns one deck into a multi-variable experiment, and Victory Analytics, which models the results.

Applications

Advanced CMOS

Bulk CMOS, PDSOI, FDSOI and FinFET

Power, RF and BCD

Power diodes, IGBTs, thyristors, GaN HEMTs, SiC DMOS and SiC LDMOS

Display

Amorphous and poly-Si TFTs, IGZO TFTs, LEDs, OLEDs and MicroLEDs

Optoelectronics

CCDs, CMOS image sensors, avalanche and PiN photodiodes, and solar cells

Proof and resources

Product brief · PDF

February 2022

Victory Visual and the TCAD pre- and post-processing tools

The tools around your TCAD runs, Victory Visual among them, in one brief. It's listed in the Silvaco library as Interactive Tools.

Start with a device you already simulate

Victory Visual is easiest to judge on a device you already know. Bring one of your own
structures to an application engineer and look at it together, including the views your
fab-side colleagues would need.

Victory Visual questions

What is Victory Visual?

Victory Visual is the interactive results viewer in Silvaco's TCAD tool set. Open a simulated device and you can turn and probe it in 3D, cut 2D slices through it, and plot curves, contours or isosurfaces of whatever quantity the simulator solved. Inside FTCO, it works with Victory DoE and Victory Analytics.

All of them: Victory Process, Victory Device, Victory Atomistic, Victory Mesh and Victory RCx. Process and device structures load the same way whichever simulator produced them, and there's no separate viewer to learn for each engine. Extracted 1D curves open there too.

DeckBuild is where you write, debug and run a simulation deck. Victory Visual is where you study what that deck produced. They're integrated, so structures and curves from a DeckBuild run open automatically. If you run the simulation, you'll use both; if you only need to read the result, Victory Visual is the one you open.

Yes. Place the cut plane anywhere through a 3D structure and you get a 2D slice at that position. From there you can read values at individual points and take measurements with the same probes and rulers you'd use on any 2D structure.

Yes. Along with the 1D x-y plots and 2D contour and meshed views it uses for most results, Victory Visual draws Smith charts and polar charts. That keeps RF device work, a GaN HEMT for example, in the same tool as your process and device structures.

Silvaco groups Victory Visual with its Interactive Tools. The Victory Omni annual license covers Silvaco TCAD software except those tools, so Victory Visual sits outside that license. Talk to our Technical Experts about the licensing option that fits alongside your TCAD seats.

A suite of GUI applications for building, running, debugging and visualising Silvaco TCAD simulations — DeckBuild, Victory Visual, Victory DoE and Silver. They are integrated with each other, so one interface drives every Silvaco TCAD simulator rather than one front end per engine.

Yes, and there are two layers. DeckBuild has an integrated Python 3 module for simulator control, custom extract mechanisms and custom GUI components. Separately, runtime scripting inside the deck itself gives you variables, loops, if/else statements and file control commands.

Silver is the user interface to the Silvaco Material Database, SMDB. It searches every process and device parameter for every material, interface and element, lets you copy the syntax for changing one straight into your deck, and plots a parameter against temperature.

Related tools and workflows

Fab Technology Co-Optimization (FTCO)

the workflow Victory Visual belongs to

Victory DoE

design-of-experiments tables built from a single deck

Victory Analytics

machine-learning analytics on your experiment data

Silvaco TCAD

the process and device simulators whose results Victory Visual displays

Victory Process

process simulation

Victory Device

device simulation

Display

TFT, OLED and MicroLED device work