

Requires: Utmost IV, SmartSpice, SmartView
Minimum Versions: Utmost IV 1.10.6.R, SmartSpice 4.10.2.R, SmartView 2.28.2.R
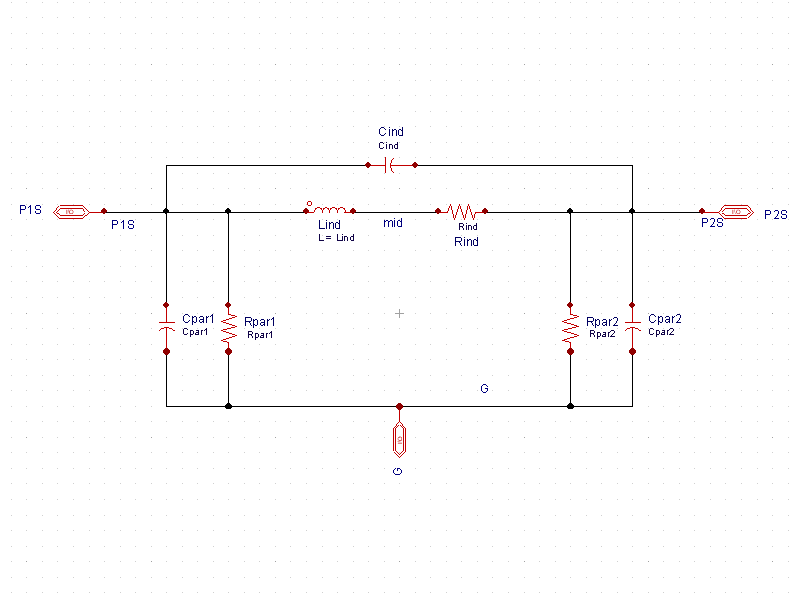
This example describes how to extract a simple hybrid Pi macro=model for
an RF inductor. The schematic for the hybrid Pi model is shown in
opt_ex08_01.png
. To extract the model, a typical s-parameter measurement
is required over the frequency range of interest.
The hybrid Pi inductor macro model is a simple inductor model containing an
inductance (Lind) and resistance (Rind) in series which model the low
frequency behaviour of the device. The capacitance Cind models the resonant
frequency of the inductor which is in parallel to the series resistance and
inductance, and the four remaining components model the parasitic losses of
the device.
The project file
opt_ex08.prj
and the data file
opt_ex08.uds
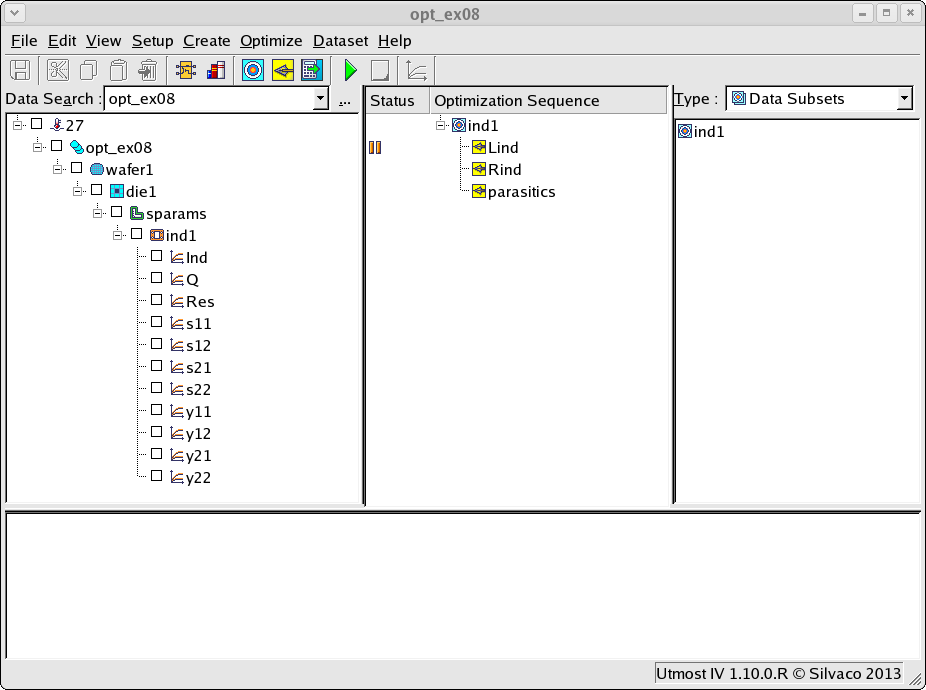
for this example should be loaded into your database. When opened, the
project will look as shown in
opt_ex08_02.png
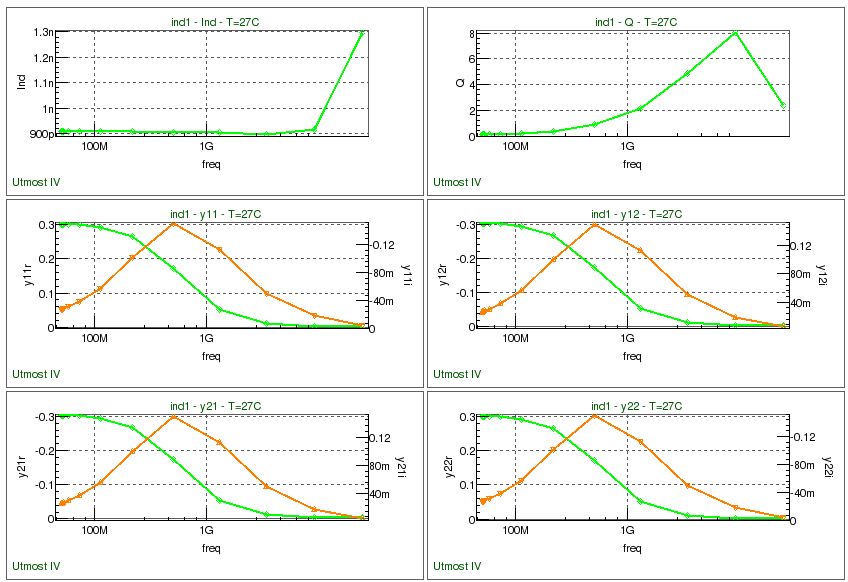
and when plotted, the example measured data will look as shown in
opt_ex08_03.png
. Included in the measured data are some calculated data representing the
ideal inductance and quality factor for the inductor being characterised.
The formulae used to calculate these values are as follows;
Ind = y21i / (2 * 3.14159 * freq * y21m*y21m)
Q = (-1) * y11i / y11r
The optimization sequence, which fully automates the extraction of this
hybrid Pi inductor macro model example, has three sections.The first
section takes the low frequency calculated inductance data and extracts
the value of the series inductance. The second section takes the low
frequency data and extracts the value of the series resistance of the
device. The third section looks at all of the data including the high
frequency data and extracts the parasitic loss and resonant circuit
element values.
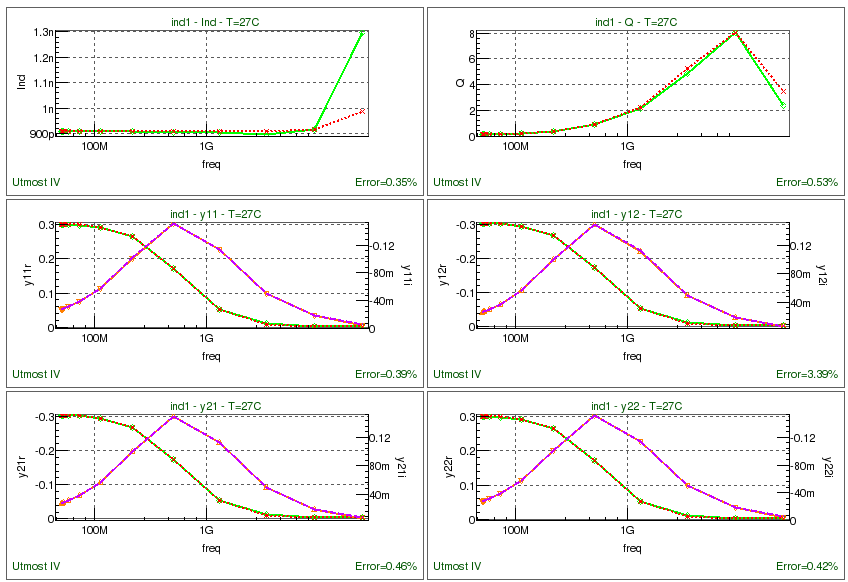
On completion of the sequence, the measured versus simulated
characteristics should be as shown in
opt_ex08_04.png
. The model params for the individual hybrid Pi circuit elements
can then be exported into an external model library file as shown
in the output file
opt_ex08.lib. You also have to construct a subcircuit representing the netlist
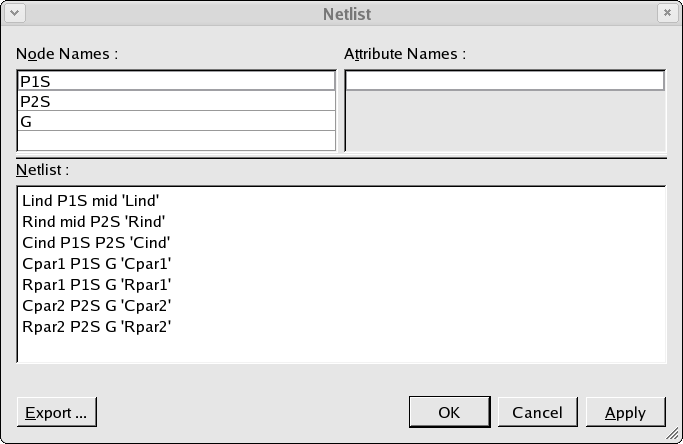
which was used for the model parameter extraction. The netlist for
the hybrid Pi model is as shown in
opt_ex08_05.png
.
Graphics
Files
opt_ex08.lib
.LIB demo

.PARAM Lind = 9.07152e-10
.PARAM Rind = 3.29719
.PARAM Cind = 3.56451e-15
.PARAM Cpar1 = 1.43449e-14
.PARAM Rpar1 = 963.065
.PARAM Cpar2 = 1.50785e-14
.PARAM Rpar2 = 974.599

.SUBCKT ind1 P1S P2S G

Lind P1S mid 'Lind'
Rind mid P2S 'Rind'
Cind P1S P2S 'Cind'
Cpar1 P1S G 'Cpar1'
Rpar1 P1S G 'Rpar1'
Cpar2 P2S G 'Cpar2'
Rpar2 P2S G 'Rpar2'

.ENDS

.ENDL demo
opt_ex08.uds
Utmost IV CSV Data Logfile
Format Version 1.0
Copyright (c) 1984 - 2016, Silvaco, Inc. All rights reserved

DataSetStart

DataSetName, sparams
MeasurementType, AC

BatchName, opt_ex08
WaferName, wafer1
DieName, die1
GroupName, group1
DeviceName, ind1
Temperature, 27

FabDate, 11 Jun 2007
UserDate, 11 Jun 2007

NodeNames, P1S P2S G

ACPort, 1, P1S, G, 0, 0, 0
ACPort, 2, P2S, G, 0, 0, 0


Sweep, 1, freq, LIST

List, 1
5e+07          5.00002e+07    5.00009e+07    5.00027e+07    5.00075e+07
5.00206e+07    5.00563e+07    5.01532e+07    5.04166e+07    5.11326e+07
5.30789e+07    5.83697e+07    7.27513e+07    1.11845e+08    2.18112e+08
5.06975e+08    1.29219e+09    3.42662e+09    9.22859e+09    2.5e+10

Constant, V, G, 0
Constant, V, P1S, 0
Constant, V, P2S, 0

Function, Ind, y21i / (2 * 3.14159 * freq * y21m*y21m)
Function, Q, (-1) * y11i / y11r
Function, Res, (-1) * y21r / (y21m * y21m)

Plot, Ind, XY (LOG LIN), freq, Ind
Plot, Q, XY (LOG LIN), freq, Q
Plot, Res, XY (LOG LIN), freq, Res
Plot, s11, XYY (LOG LIN LIN), freq, s11r, s11i
Plot, s12, XYY (LOG LIN LIN), freq, s12r, s12i
Plot, s21, XYY (LOG LIN LIN), freq, s21r, s21i
Plot, s22, XYY (LOG LIN LIN), freq, s22r, s22i
Plot, y11, XYY (LOG LIN LIN), freq, y11r, y11i
Plot, y12, XYY (LOG LIN LIN), freq, y12r, y12i
Plot, y21, XYY (LOG LIN LIN), freq, y21r, y21i
Plot, y22, XYY (LOG LIN LIN), freq, y22r, y22i

DataArray, s11i
0.00176454     0.00176373     0.00176361     0.00176356     0.00176376
0.00176421     0.00176549     0.00176891     0.00177817     0.00180347
0.0018721      0.00205851     0.00256611     0.00394615     0.00770766
0.0180815      0.0484333      0.143189       0.343996       0.18128

DataArray, s11r
0.0319101      0.0319101      0.0319101      0.0319101      0.0319101
0.0319101      0.0319101      0.0319101      0.0319101      0.03191
0.0319096      0.031909       0.0319055      0.0318921      0.0318289
0.0314871      0.0302976      0.0444911      0.212029       0.781562

DataArray, s12i
-0.00357507    -0.00357489    -0.00357513    -0.0035754     -0.00357571
-0.00357667    -0.00357919    -0.00358612    -0.00360498    -0.00365614
-0.0037953     -0.00417381    -0.00520166    -0.00799509    -0.0155735
-0.0359546     -0.0880786     -0.203302      -0.427343      -0.431355

DataArray, s12r
0.968061       0.968061       0.968061       0.968061       0.968061
0.968061       0.968061       0.968061       0.968061       0.96806
0.968058       0.968053       0.968036       0.967969       0.967649
0.965778       0.954586       0.905583       0.71257        0.106863

DataArray, s21i
-0.00357519    -0.003575      -0.0035752     -0.00357545    -0.00357576
-0.00357671    -0.00357924    -0.00358617    -0.00360504    -0.00365619
-0.00379536    -0.00417387    -0.00520173    -0.00799522    -0.0155738
-0.0359553     -0.088079      -0.203257      -0.426224      -0.402043

DataArray, s21r
0.968061       0.968061       0.968061       0.968061       0.968061
0.968061       0.968061       0.968061       0.968061       0.96806
0.968058       0.968053       0.968036       0.967969       0.967649
0.965779       0.954596       0.905614       0.712463       0.102915

DataArray, s22i
0.00176708     0.00176623     0.00176606     0.00176596     0.00176617
0.00176661     0.0017679      0.00177132     0.00178059     0.00180592
0.00187466     0.00206128     0.00256959     0.00395153     0.00771838
0.0181089      0.0485347      0.143696       0.346015       0.200284

DataArray, s22r
0.03191        0.03191        0.03191        0.03191        0.03191
0.03191        0.03191        0.0319099      0.0319099      0.0319098
0.0319094      0.0319089      0.0319053      0.0318914      0.0318261
0.0314711      0.0302023      0.0441483      0.210886       0.782487

DataSetFinish