

Minimum Versions: SmartSpice 4.6.5.R
The
input deck shows you how to produce a single element that behaves as a Frequency Modulated (FM) source.
The Waveform
results
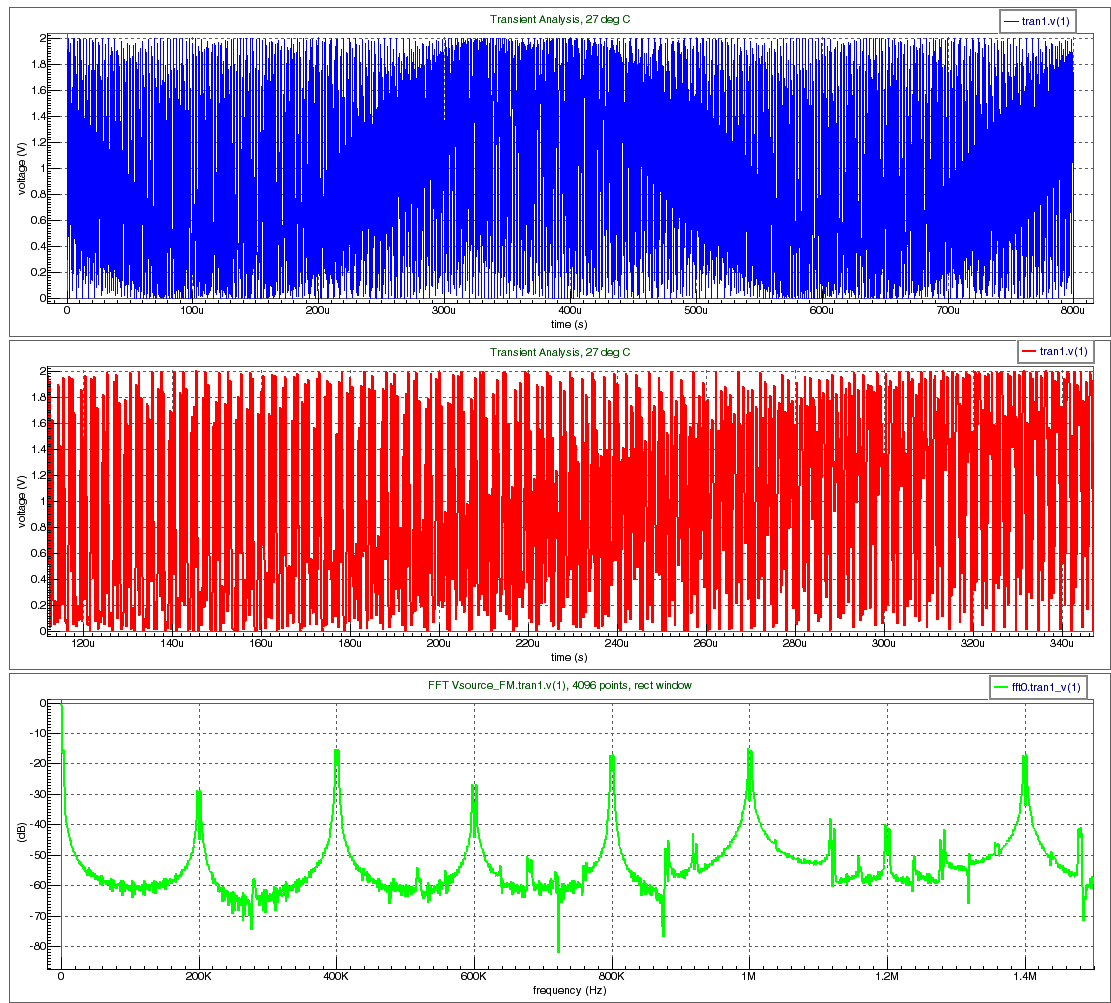
show how the final frequency modulated waveform output looks in the time domain for both full and zoomed time periods.
The lower plot of the 3 shows a rough FFT interpretation of the transient waveform.
(Remember that an FFT is a cyclic analysis requiring regular-spaced, time period samples.
So to construct this FFT from the irregular-spaced, transient analysis timepoints, some distortion is introduced – the minimum value only gets down to -60db level).
Note:
To do an accurate FFT plot use
.OPTION FFT_ACCURATE
and do an
.FTT
analysis.
Graphics
Input Files
Vsource_FM.in
* Frequency Modulated Source element
.option nomod nodeck accurate

.param fm =200k
V1 1 0 sffm(1 1 2k 10 FM )
R1 1 0 100k
.tran .02u 800u ;sweep fm 5k 20k 5k
.save all(v)
.end