

Requires: SmartSpice & Smartview
Minimum Versions: SMARTSPICE 4.6.5.R
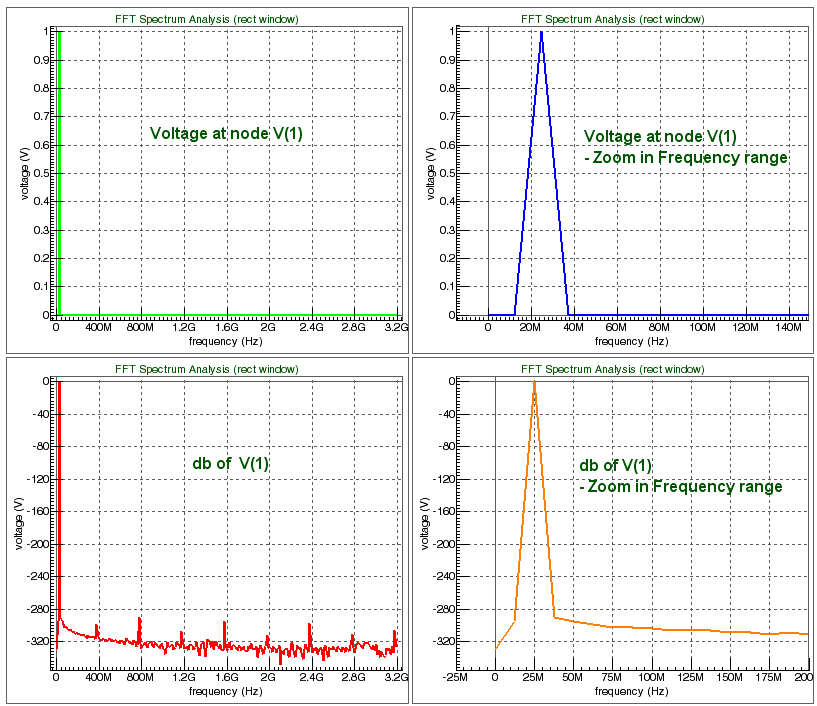
A simple input deck running .FFT and .MEASURE analysis on a circuit shows variation in response to changes in the frequency of the source by rubberbanding parameter frequency in the SIN function of the voltage source.
Graphics
Input Files
rubberband_example_16.in
*FFT &  Rubberband
 *  rubberband parameter   frequency= 2.5e07   in  sin  function

V_V3         1 0  sin(0 1   2.5e07)
R_R2         0 1  1k

.TRAN   1n   80n
.fft v(1)      np=512;format=unormFMIN=40Meg  FMAX=120Meg
*.fft v(1)    np=1024;format=unormFMIN=40Meg  FMAX=120Meg
.probe  fft  vdb(1)
.options  fft_accurate

.measure  fft FFT_MAX_FREQ AMAX vdb(1)
.measure  fft FFT_AVG      AVG  vdb(1)

.END