

Requires: SmartSpice & Smartview
Minimum Versions: SMARTSPICE 4.6.5.R
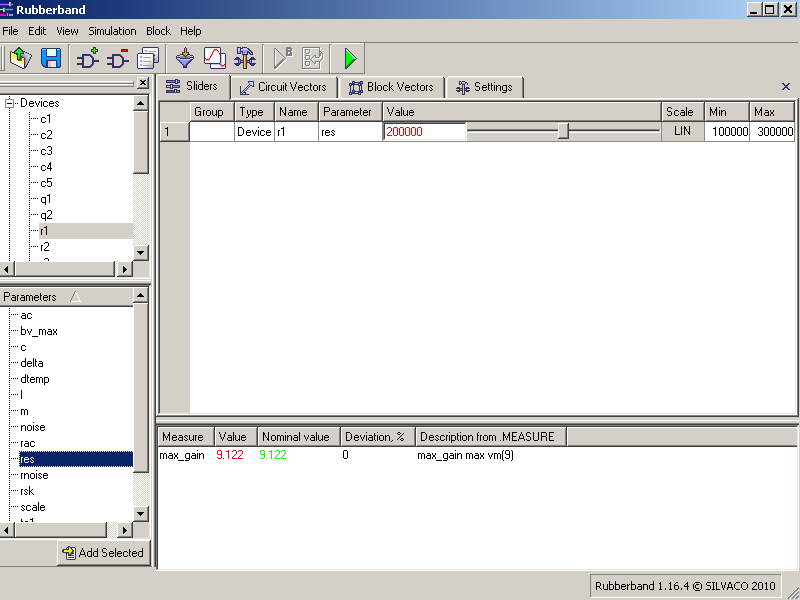
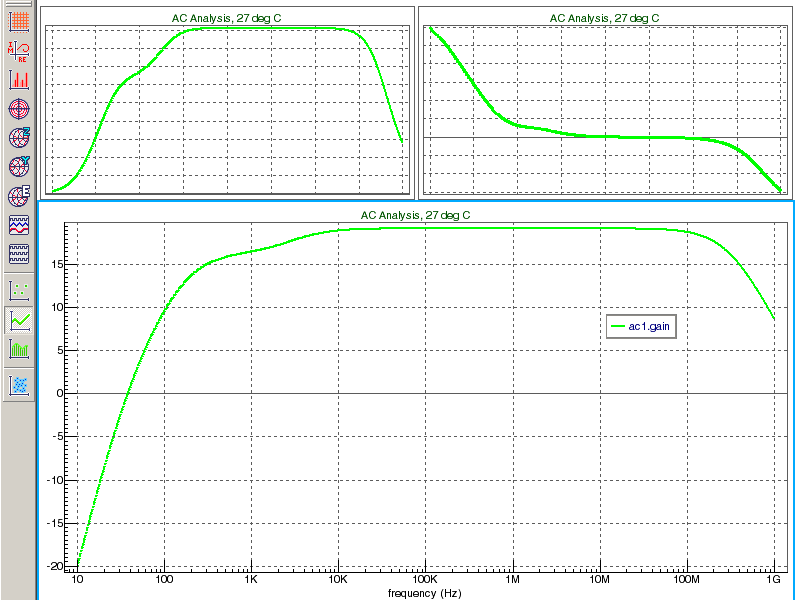
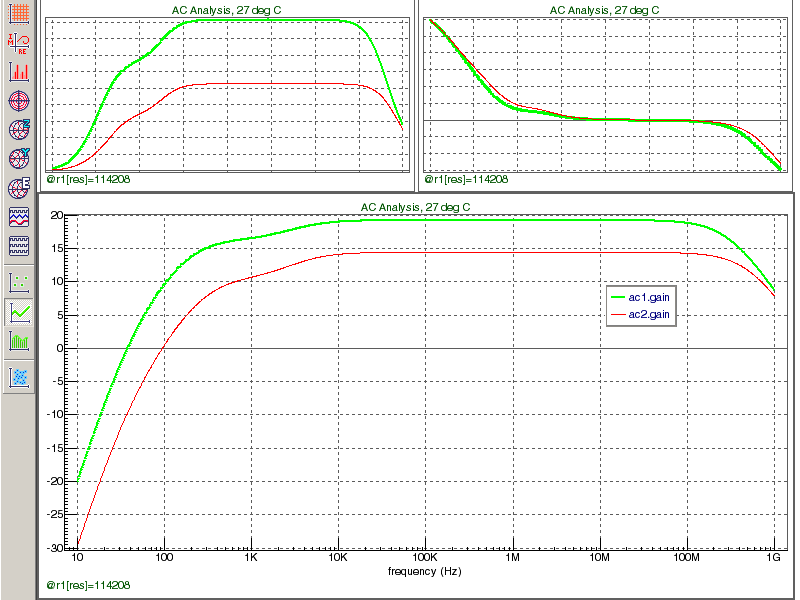
The input deck is a 2 stage amplifier with .AC and .MEASURE anlysis. Vary the model instance parameter r1[res]. You can see by changing the slider and hence the value of this resistor, how the gain/frequency response changes. This gives you a good idea of the circuit sensitivity to the variation in value of a circuit component.
Graphics
Input Files
rubberband_example_02.in
* Two stage amplifier
* Input node 2, output node 9
* Rubberband parameters
* r1[res]

vin 2 0 ac 1
vcc 10 0 dc 15
RL 9 0 10k
c1 2 3 10uf
r1 3 10 200k
r2 3 0 50k
r5 10 4 12k
q1 4 3 5 qmod
r6 5 0 3 .6k
c2 4 6 10uf
c4 5 0 15uf
r3 10 6 120k
r4 6 0 30k
r7 10 7 6 .8k
q2 7 6 8 qmod
r8 8 0 3 .6k
c5 8 0 25uf
c3 7 9 10uf

.model qmod npn ( is=2e-16 bf=50 br=1 rb=5 rc=1 re=0
+ cje =0.4e-12 vje =0.8 me=0.4 cjc =0.5e-12 vjc =0.8 ccs=1e-12 va=100)

.ac dec 200  10 1G

.probe vp(9)

.let gain = vdb(9)
.MEASURE AC MAX_GAIN MAX VM(9)

.end