

Requires: SmartSpice & Smartview
Minimum Versions: SMARTSPICE 3.38.1.R
- Distortion Analysis example.
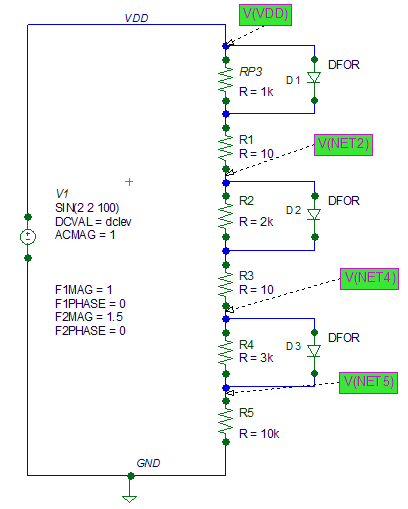
This is a simple example to show how to use the Distortion analysis to analyse the unwanted frequency components of a circuits response. The
schematic
shows a simple circuit on which we will run this distortion anlysis.
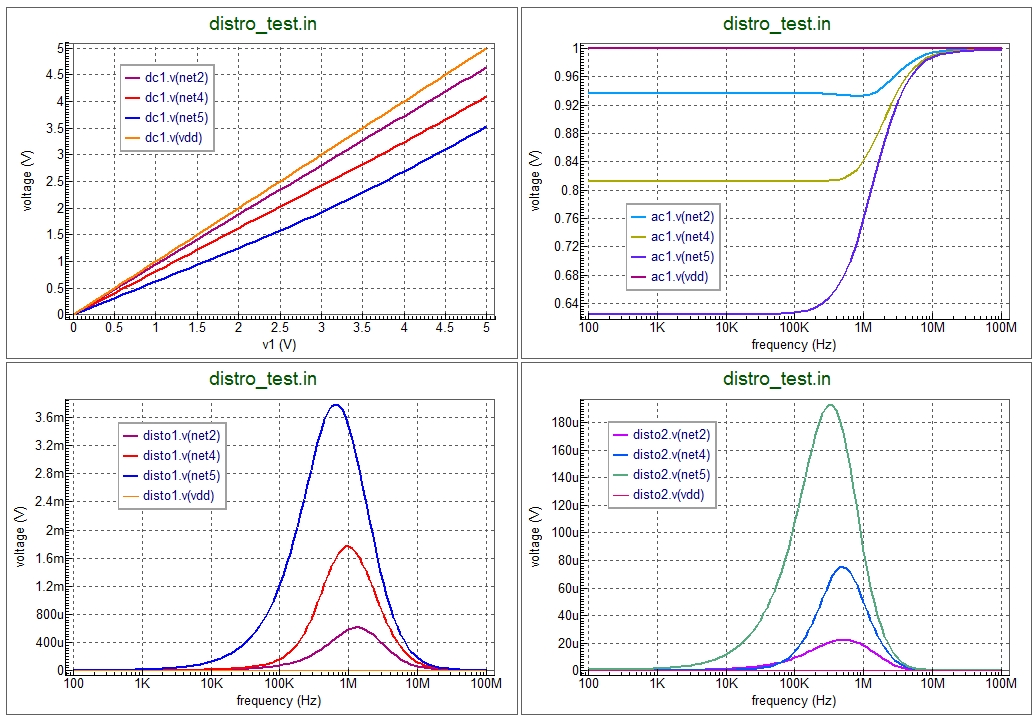
Having run the analysis you will get these set of response
plots
for the different analysis run of .DC .AC and .Disto run.
Graphics
Input Files
distro_test.in
* Schematic name: distro_test
***********************************cs
RP3 VDD NET1 1k
V1 VDD GND DC dclev AC 1 DISTOF1 1 0 DISTOF2 1.5 0
D1 VDD NET1 DFOR
D2 NET2 NET3 DFOR
D3 NET4 NET5 DFOR
R1 NET1 NET2 10
R2 NET2 NET3 2k
R3 NET3 NET4 10
R4 NET4 NET5 3k
R5 NET5 GND 10k

.GLOBAL GND

.SAVE V(NET2) V(NET4) V(NET5) V(VDD)

.param dclev=0.0

.MODEL Dfor D (                 IS     = 6.241691E-4
+ RS    = 2.755033E-7     N     = 1.4816888       BV   = 11
+ IBV   = 1E-3            IK    = 3.5781E5        IKR  = 1.7E-3
+ JSW   = 1.233925E-9     AREA  = 7.5E-8          PJ   = 1.1E-3
+ CJ    = 1.01432E-3      PB    = 0.626873        MJ   = 0.373377
+ FC    = 0.5             CJSW  = 1.67236E-10     PHP  = 0.626873
+ MJSW  = 0.0748074       CTA   = 1.02351E-3      CTP  = 1.22727E-3
+ TLEV  = 1               EG    = 1.17            XTI  = 3
+ TRS   = 3.222E-3        TLEVC = 1               TPB  = 1.39435E-3
+ TCV   = -7E-4           TPHP  = 1.39435E-3      TREF = 25
+ LEVEL = 3               )

.DC V1 0 5 0.1
.AC dec 10 100 100Meg
.DISTO dec 20 100 100MHz

.save all(v)

.end
026_Distro_sim
[an error occurred while processing this directive]