Requires: Utmost IV, SmartSpice, SmartView
Minimum Versions: Utmost IV 1.10.6.R, SmartSpice 4.10.6.R, SmartView 2.28.2.R
This example describes how to measure a dataset using either a linear
sweep or a list sweep. For demo purposes, the example will measure or more
correctly acquire the dataset using simulation mode, rather than using
measurement mode.
The project file
acq_ex02.prj
for this example should be loaded into your database. When opened, the
project will look as shown in
acq_ex02_01.png
.
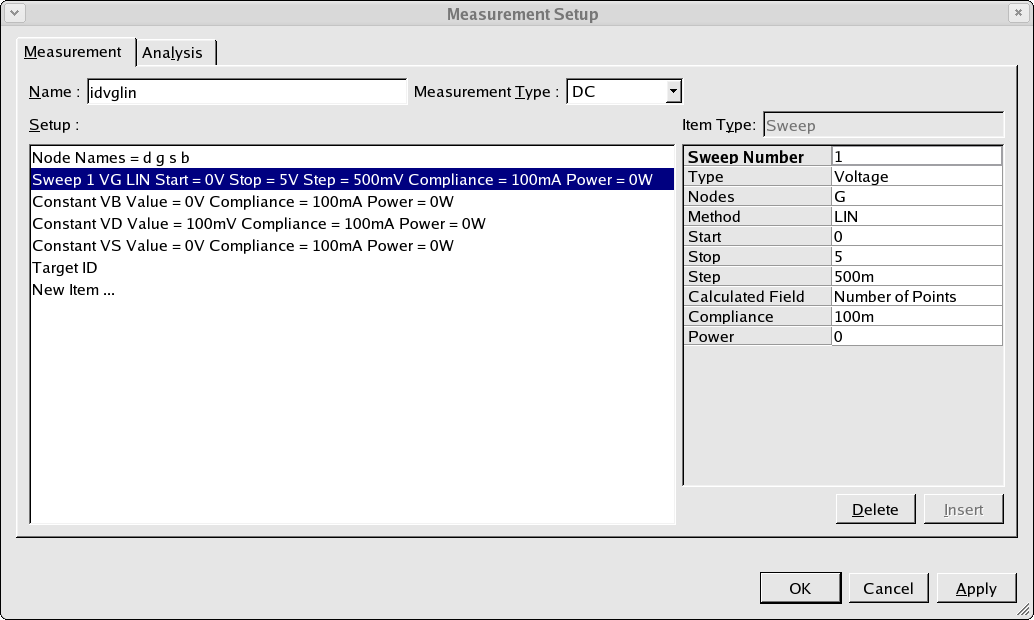
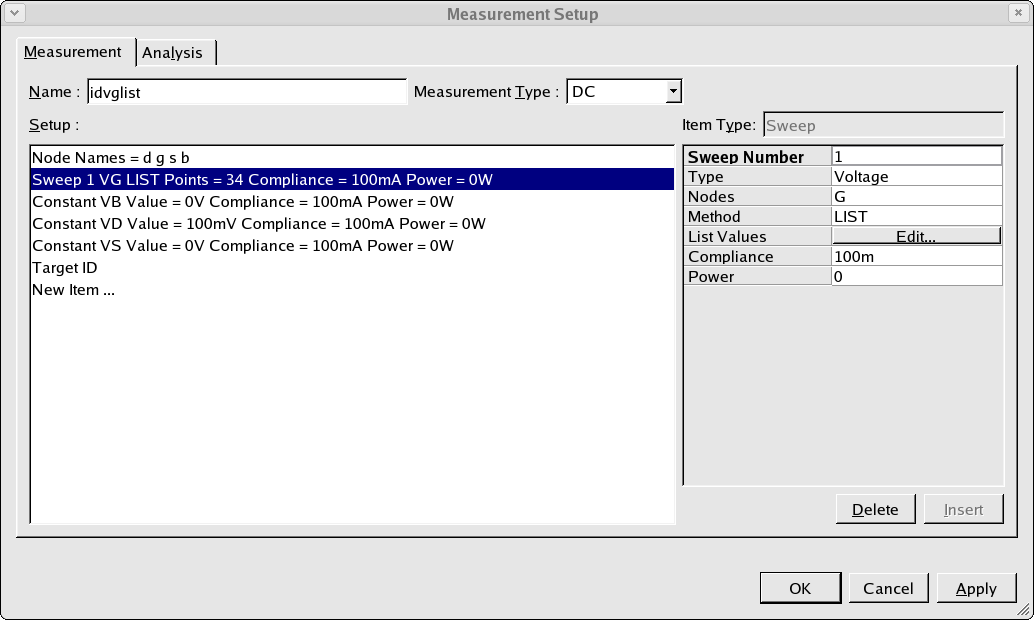
This project contains two measurement setups, one containing a linear sweep
on the gate (node g) of the transistor shown in
acq_ex02_02.png
, the second containing a list sweep as shown in
acq_ex02_03.png
.
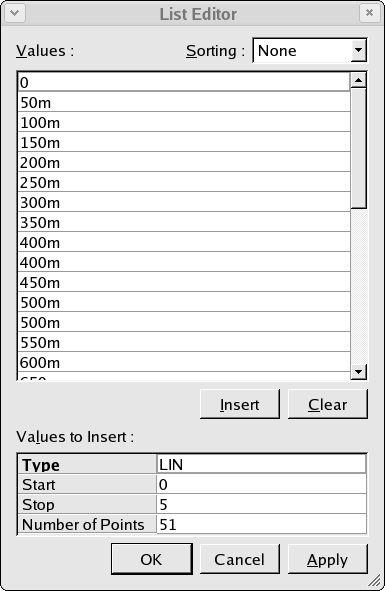
The list sweep is defined using the list editor dialog shown in
acq_ex02_04.png
. The list can contain any number of points in any order. The
example shows one typical use of the list sweep, where more
measurement points are desired at low gate voltage and then fewer
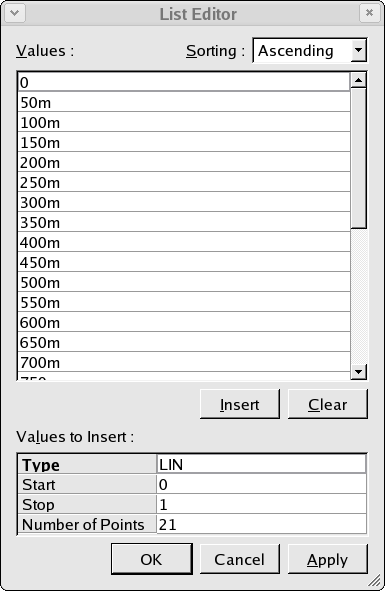
at a higher gate voltage. This was achieved by adding 21 points
between 0 and 1 volt and then 11 additional points between 0 and
5 volt. The sweep was then sorted which removed the duplicate
values and sorted into ascending order as shown in
acq_ex02_05.png
.
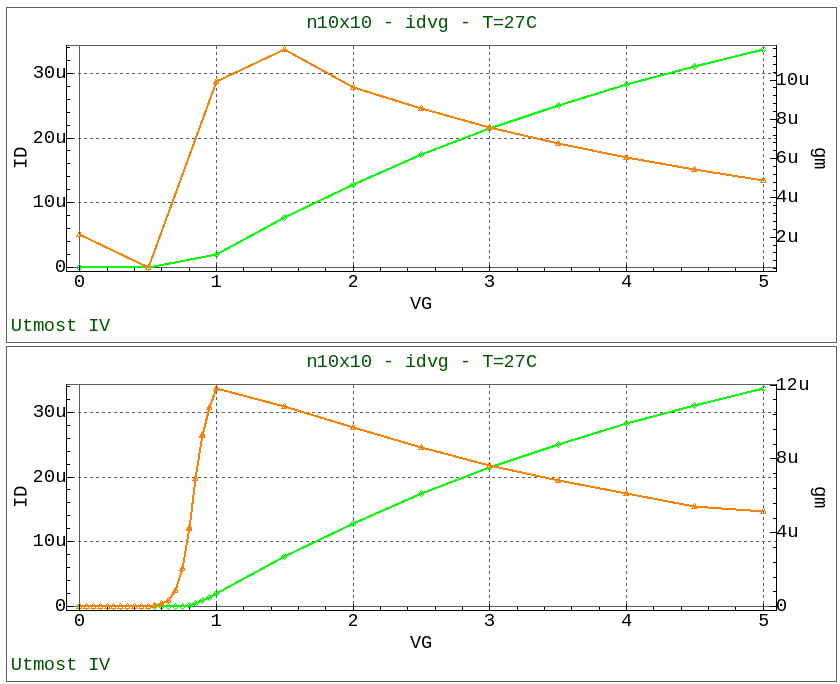
When the measurement sequence is run, two datasets are generated
and stored into the database automatically. Viewing both of these
datasets together shows the difference between the two, with the
list sweep having more points measured in the subthreshold region
shown in
acq_ex02_06.png
.
Graphics