cor_ex01 : Retargeting a Model Card
Requires: Utmost IV, SmartSpice, SmartView
Minimum Versions: Utmost IV 2.19.2.R, SmartSpice 5.2.0.R, SmartView 2.2207.0.R
This example shows how to use the Utmost IV Corner and Retargeting module to generate an updated (retargeted) model for an existing MOSFET SPICE base (or nominal) model card. This is needed when the process changes slightly. In such a case, instead of a complete and costly model re-extraction, based on a full set of characteristics, one can just retune a few model parameters, based on a limited set of key targets. This operation is called "retargeting a model".
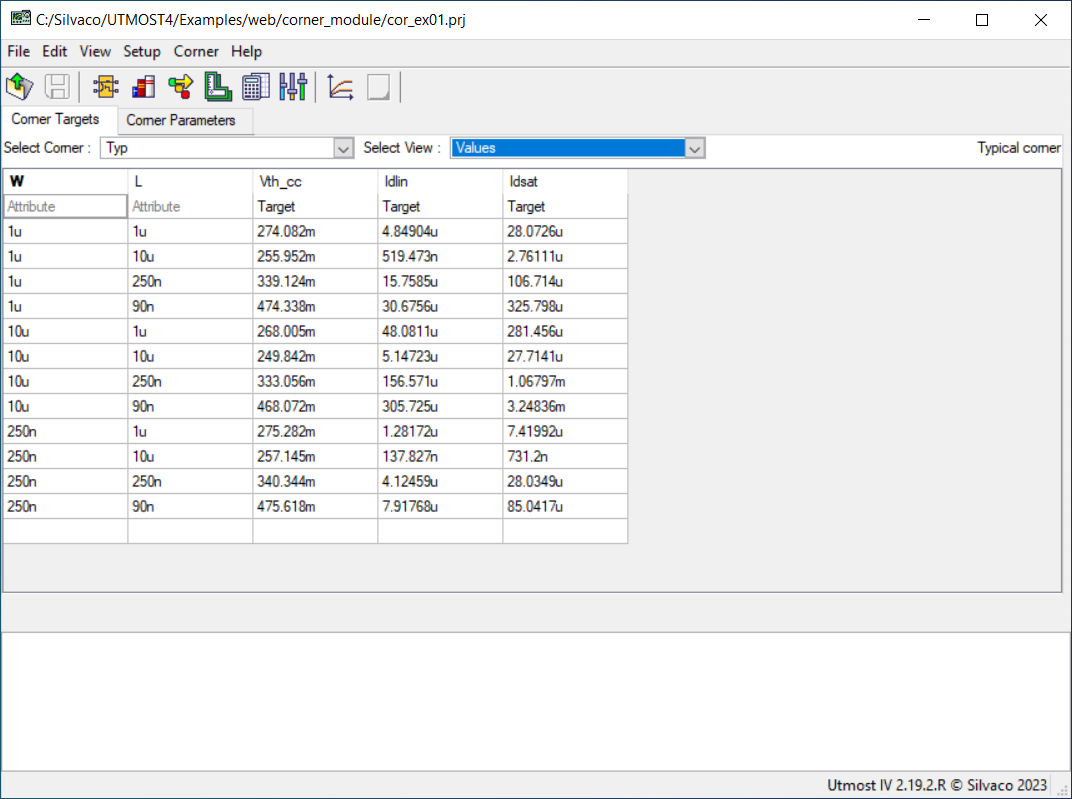
The project file cor_ex01.prj for this example should be loaded into your Utmost IV Corner and Retargeting module. The corner module uses Electrical Table (ET) data. The measured data is already included in the project, as shown in the cor_ex01_01.png .
Each row in the table represents a specific device, with a particular set of attribute values. The columns can be either attributes (the first 2 columns, in this example) or targets. The data used in this example includes two attributes, W and L, and three targets, Vth_cc, Idlin and Idsat.
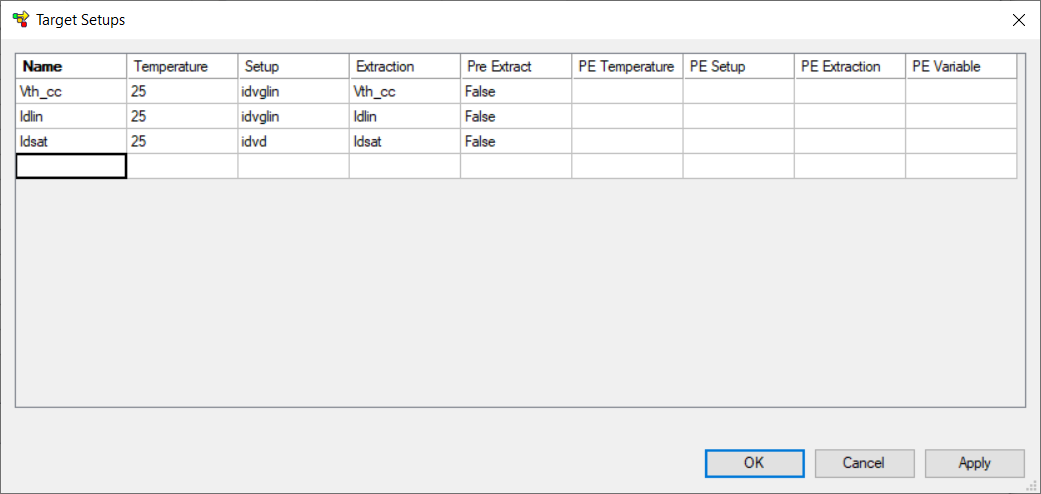
The targets are specific measurements (extractions) performed on the devices. One can examine and edit the target definitions by selecting the Setup->Target Setups menu item, as shown in cor_ex01_02.png . Each target must have the following components:
- Name: the name of the target
- Temperature: the temperature at which the target is measured
- Setup: the measurement setup used to generating device characteristics at the given temperature
- Extraction: the extraction performed on the device characteristics
- Pre Extract: indicates whether or not a preliminary extraction is needed in order to measure the target.
If a preliminary extraction is not required, the last 4 columns are empty. If a preliminary extraction is needed, the last 4 columns will contain:
- PE Delta Temperature: the temperature difference versus the main extraction, at which the preliminary extraction is performed
- PE Setup: the measurement setup used to generating device characteristics for the preliminary extraction
- PE Extraction: the preliminary extraction
- PE Variable: the variable name to store the result of the preliminary extraction
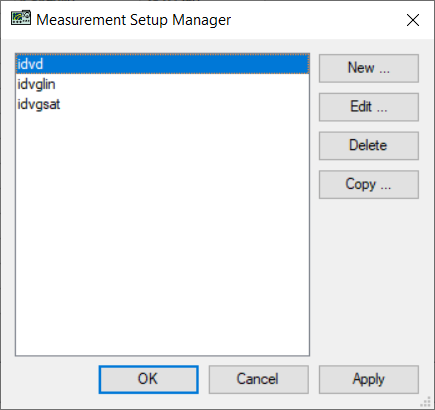
The measurement setups can be examined by selecting the Setup->Measurement Setups menu item, which opens the Measurement Setup Manager, as shown in cor_ex01_03.png .
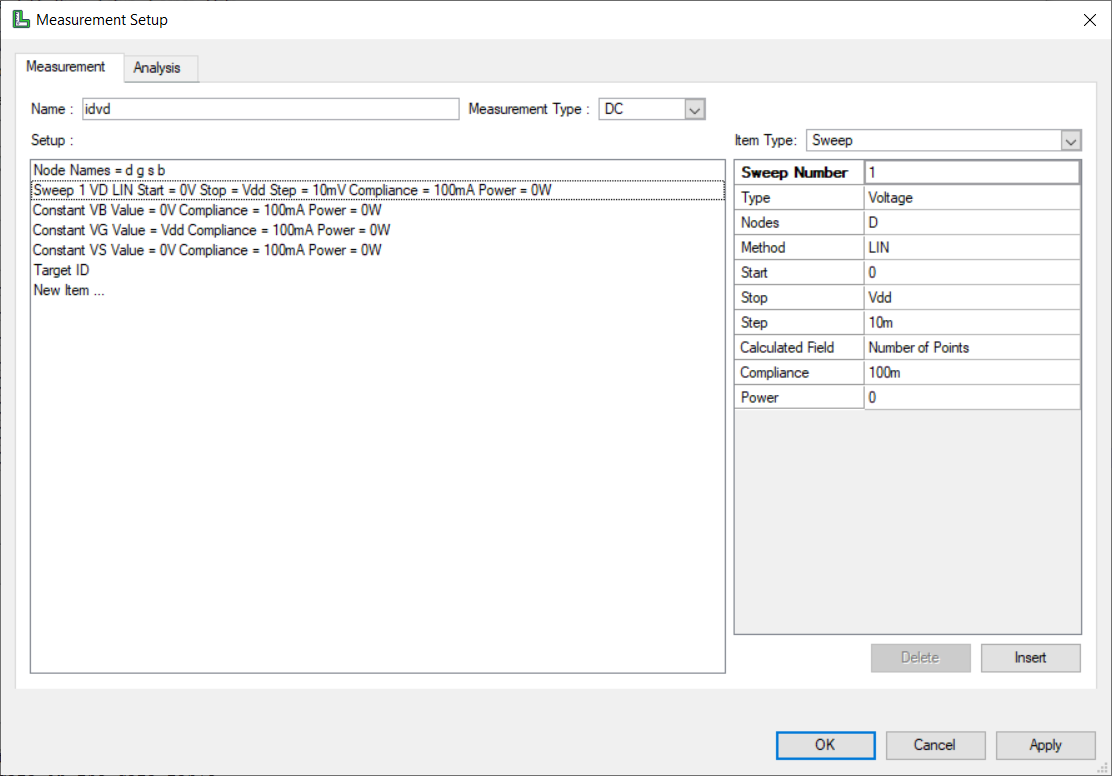
One can select a measurement setup and click the "Edit" button to examine and edit its contents as illustrated in cor_ex01_04.png . The values used in the measurement setups may depend on project variables. In this example one can notice the usage of the "Vdd" variable in the Vd sweep and in the constant value of Vg.
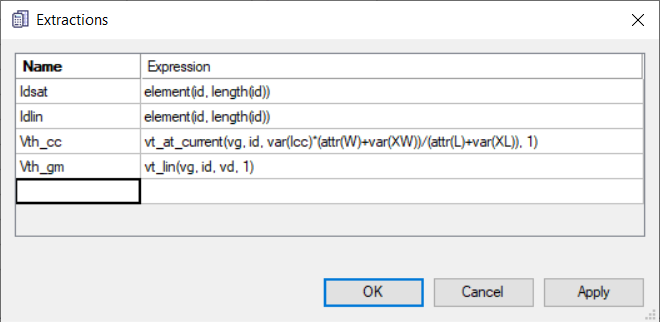
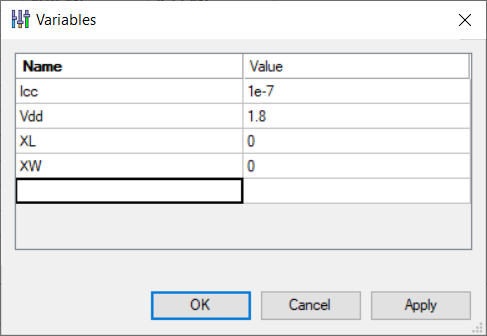
The extraction definitions can be examined by selecting the Setup->Extractions menu item, which opens the "Extractions" Dialog, as shown in cor_ex01_05.png . The extractions may depend on device attributes and/or on project variables. For example, the Vth_cc extraction is described by an expression that depends on the "L" and "W" attributes and on the "XL" and "XW" variables. The project variables can be examined by selecting the Setup->Variables menu item, which opens the "Variables" Dialog, as shown in cor_ex01_06.png .
The target definitions in the project, including their measurement setups, extractions and variables, must be the same as the ones that have been used when acquiring the data in the data table.
The data table has four views, which can be selected by using the Select View widget, as follows:
- Values: the data values to match
- Simulations: the simulated values (empty until a simulation is performed)
- Errors: the differences between data and simulated values (empty until a simulation is performed)
- Settings: the type and the values of the two warning levels for each target in the table (the error specifications)
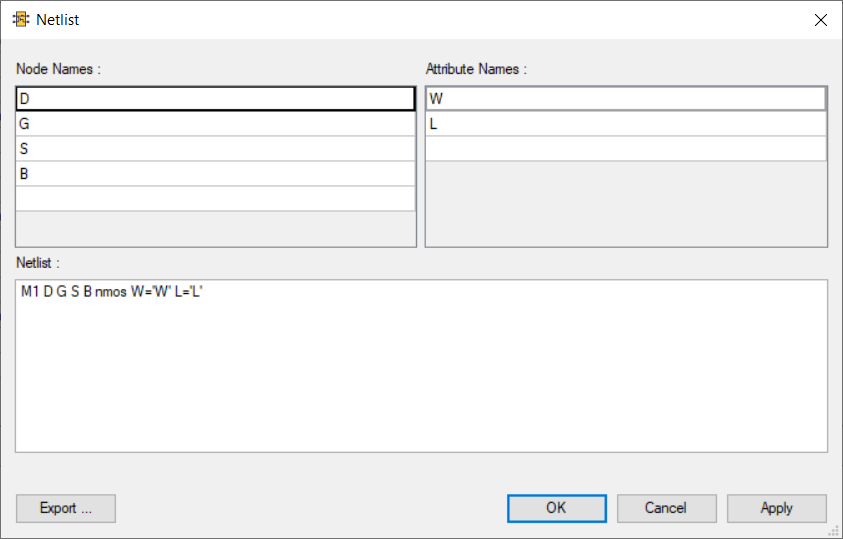
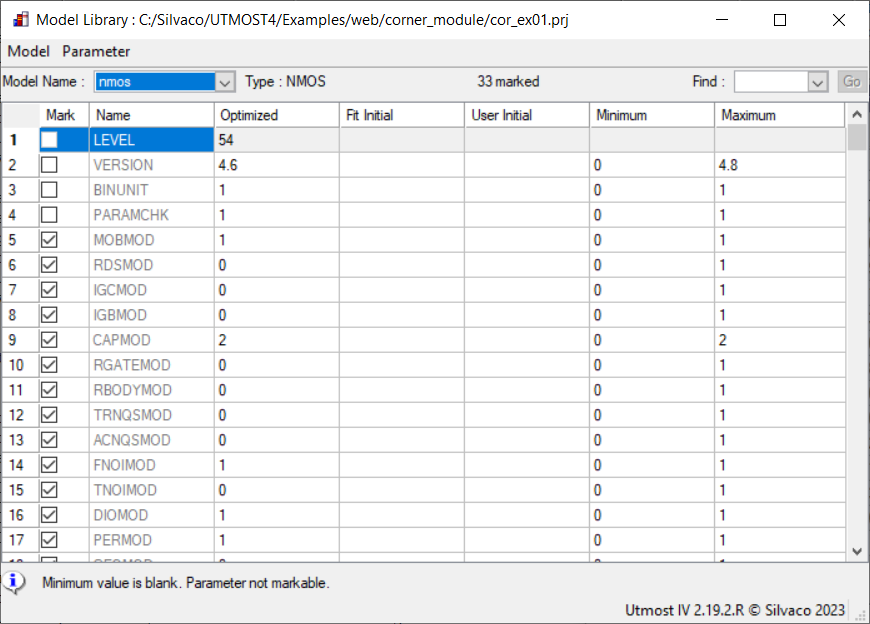
In order to perform the simulations, a device netlist is needed. The netlist can be examined by selecting the Setup->Netlist menu item, which opens the "Netlist" Dialog, as shown in cor_ex01_07.png The device netlist uses the device attributes and the base model card, in this case a compact MOSFET model called 'nmos'. The base model card can be exmined by selecting the Setup->Model Library menu item will open up the model library window as show in cor_ex01_08.png .
Data tables are available for one or more corners. Switching from one corner to another can be done through the Select Corner widget. The Corner menu contains items such as adding, renaming, deleting corners, setting the typical corner and also for editing the structure of the data table. In any corner project one corner must be set as the typical corner. This example uses only one corner, called "Typ", so this is set as the typical corner by default.
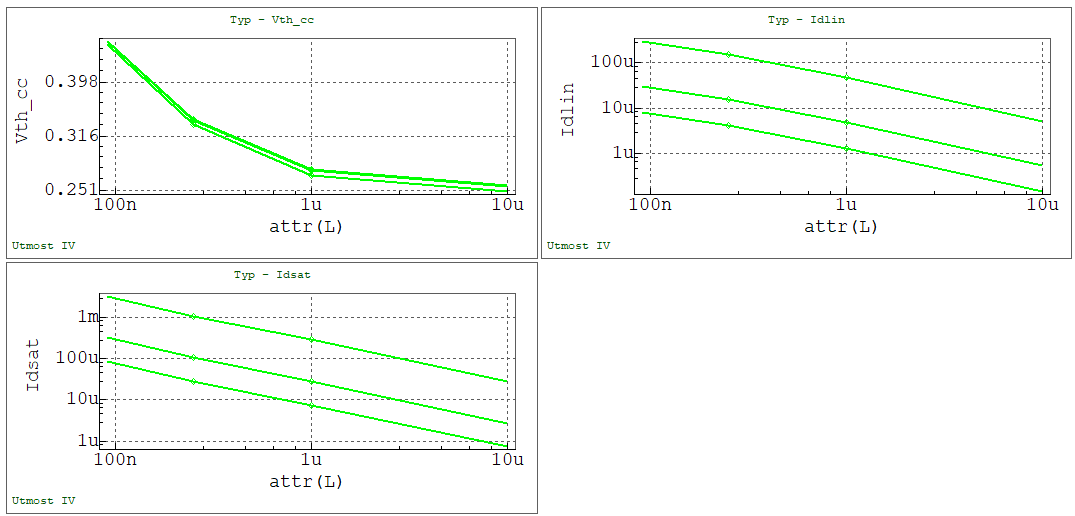
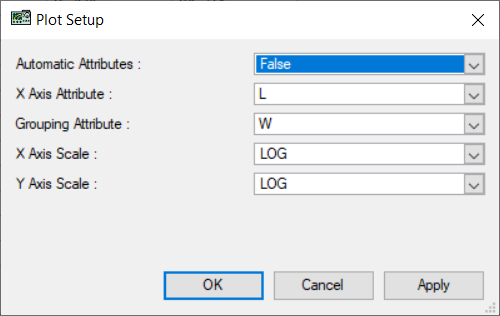
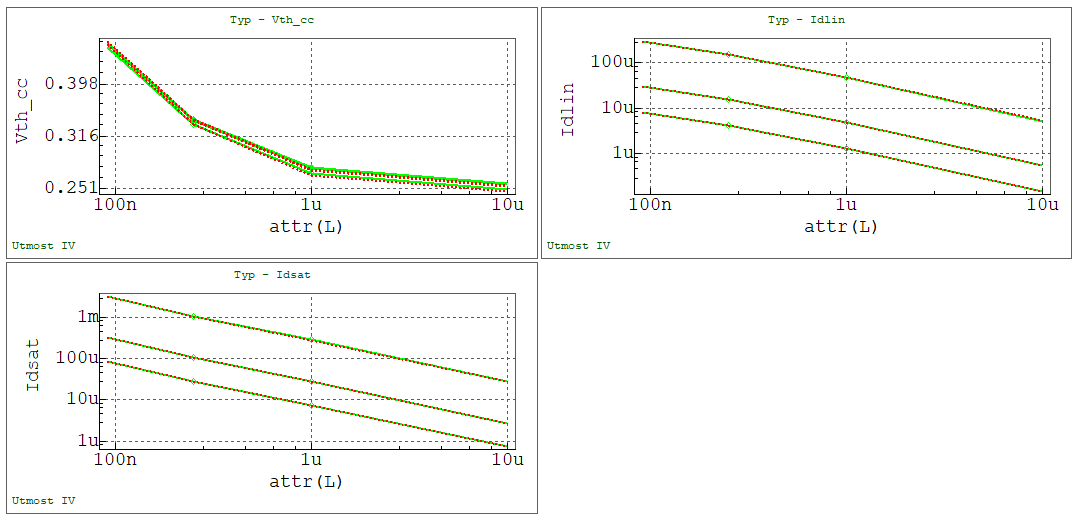
In addition to the table view, the data and the simulated values can be examined using trend plots. This is done by selecting the Corner->Plot menu item, which will display the plots in the viewer, as shown in cor_ex01_09.png . For this example the plots are shown versus the L attribute, using logarithmic scales for the X and Y axes. If needed the plot setup can be changed by selecting the Setup->Plot Setup menu item, which opens the "Plot Setup" Dialog, as shown in cor_ex01_10.png
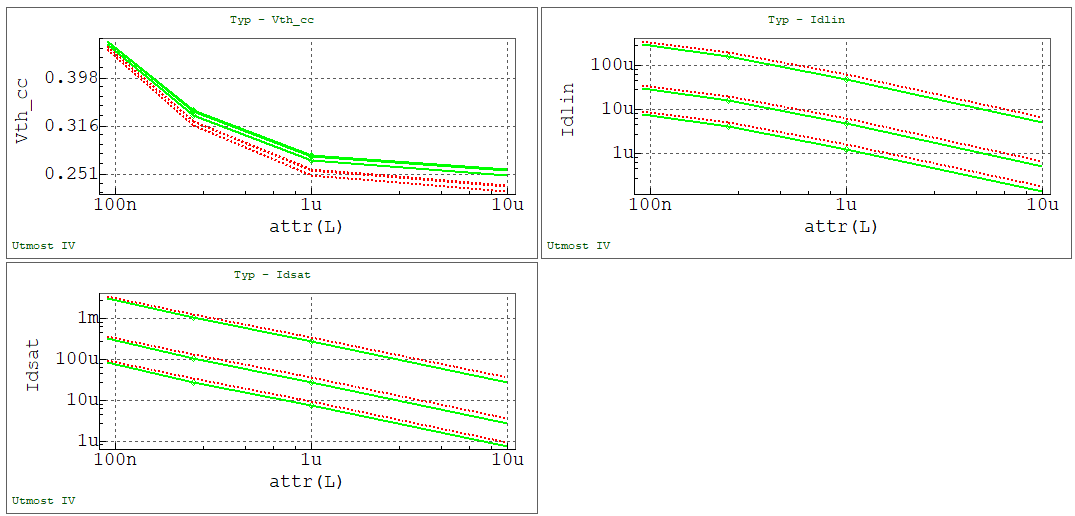
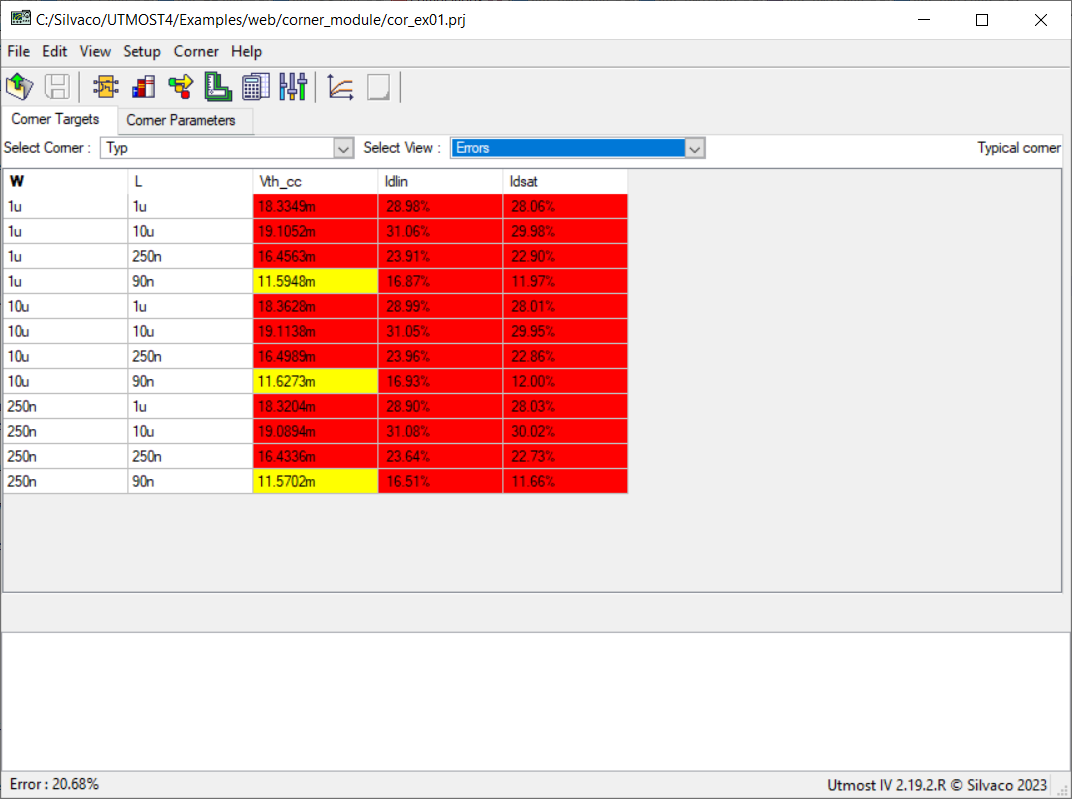
At this point, by pressing the "Simulate" button in the viewer, a simulation can be performed which will compare the measured and simulated data as shown in cor_ex01_11.png . This also updates the simulated and the error values in the table, as shown in cor_ex01_12.png . The cells in the Errors table are shown in different colors, depending on their value:
- Red: the error is larger than the Warning Level 2 value
- Yellow: the error is larger than the Warning Level 1 value, but lower than the Warning Level 2 value
- White: the error is lower than the Warning Level 1 value
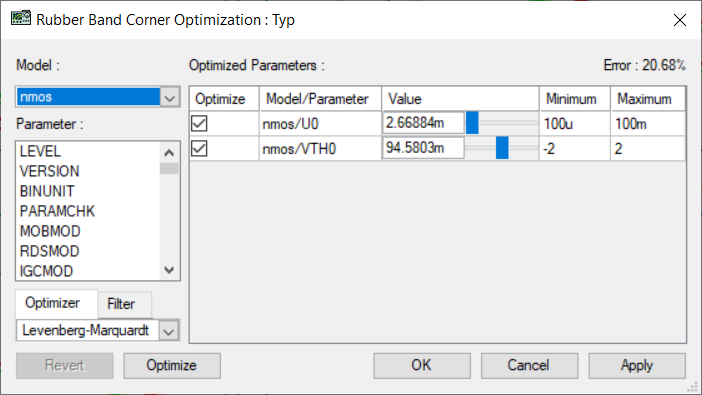
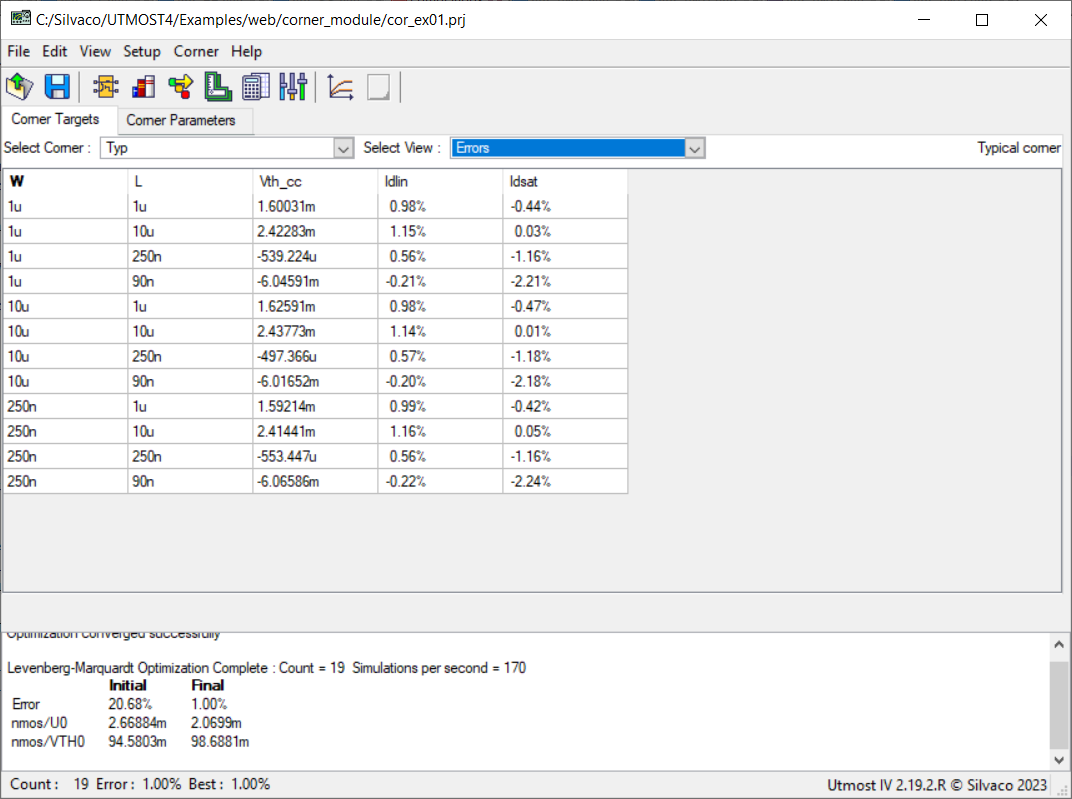
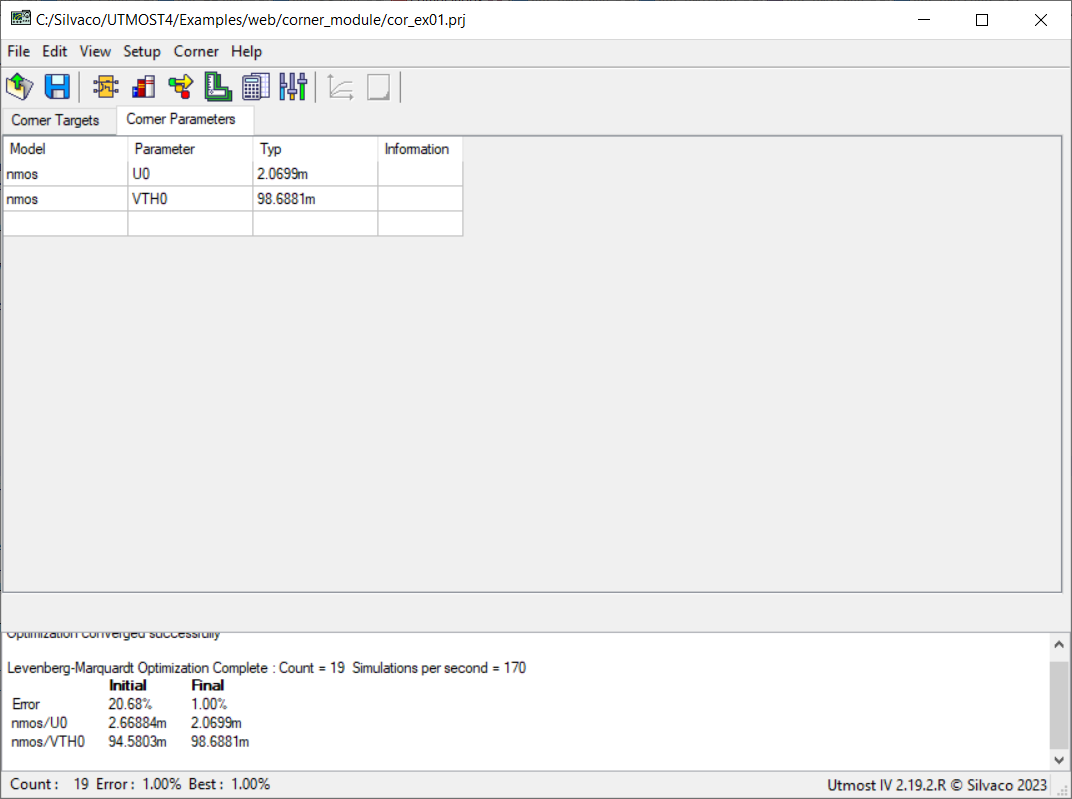
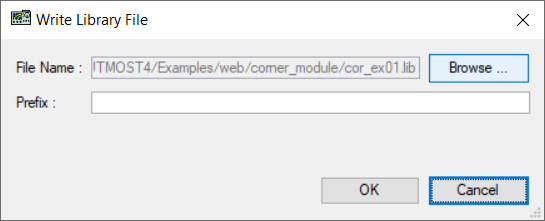
The retargeting (retuning) of the base model is done by opening the Rubberband from the viewer: cor_ex01_13.png . The selected parameters are VTH0 and U0. Pressing the "Optimize button will start the optimization. At the end of it, the Log view displays the initial and final values of the optimized parameters and of the global error value. The values in the Errors table are shown in white, which indicates that the resulting model fully meets the specifications: cor_ex01_14.png . The plots also illustrate the good fitting of the retargeted model: cor_ex01_15.png . The final parameter values can be saved by pressing the "OK" button in the Rubberband dialog. The values can be further examined in the Corner Parameters tab, as shown in cor_ex01_16.png . Furthermore, a new model library can be written by selecting the Corner->Write to Library menu item, which opens the "Write Library File" Dialog, as shown in cor_ex01_17.png . One can then specify a file name and an optional prefix for the updated model parameters.
The contents of the saved library file is show in cor_ex01.lib. The updated parameter values are saved under a library with the same name as the project corner's name ("Typ" in this example). The U0 and VTH0 parameters in the model card are referring the netlist parameters defined in the corner library.
cor_ex01.lib
											.LIB Typ
.PARAM U0_nmos  = 0.0020699
.PARAM VTH0_nmos = 0.0986881
.ENDL Typ

.LIB models
.MODEL nmos NMOS (
+LEVEL    = 54             VERSION  = 4.6            BINUNIT  = 1
+PARAMCHK = 1              MOBMOD   = 1              RDSMOD   = 0
+IGCMOD   = 0              IGBMOD   = 0              CAPMOD   = 2
+RGATEMOD = 0              RBODYMOD = 0              TRNQSMOD = 0
+ACNQSMOD = 0              FNOIMOD  = 1              TNOIMOD  = 0
+DIOMOD   = 1              PERMOD   = 1              GEOMOD   = 0
+EPSROX   = 3.9            TOXE     = 1.03e-09       DTOX     = 0
+XJ       = 1.5e-07        NDEP     = 9.42239e+16    NGATE    = 0
+NSD      = 1e+20          RSH      = 0              RSHG     = 0.1
+VTH0     = VTH0_nmos      VFB      = 1              PHIN     = -0.3074
+K1       = 0.737411       K2       = -0.117964      K3       = 279.24
+K3B      = -489.377       W0       = 1e-05          LPE0     = 1.07487e-07
+LPEB     = -7.15578e-09   DVT0     = 1.56021        DVT1     = 0.794481
+DVT2     = -0.032         DVTP0    = 0              DVTP1    = 0
+DVT0W    = 0              DVT1W    = 0              DVT2W    = -0.032
+U0       = U0_nmos        UA       = -8.62977e-10   UB       = 7.34966e-19
+UC       = 0.45946        EU       = 1.67           VSAT     = 36046.4
+A0       = 1.82081        AGS      = 0.00786686     B0       = 0
+B1       = 0              KETA     = 0.13231        A1       = 0
+A2       = 1              WINT     = 1.09686e-09    LINT     = 8.5955e-09
+DWG      = -7.09648e-09   DWB      = -7.71477e-08   VOFF     = -0.118411
+VOFFL    = 0              MINV     = -0.0764226     NFACTOR  = 22.0768
+ETA0     = 0.477988       ETAB     = -0.07          DSUB     = 0.371266
+CIT      = 0              CDSC     = 0.00024        CDSCB    = 0
+CDSCD    = 0              PCLM     = 0.649886       PDIBLC1  = 0.001
+PDIBLC2  = 1e-05          PDIBLCB  = 0              DROUT    = 0.829187
+PSCBE1   = 4.14233e+08    PSCBE2   = 0.000386234    PVAG     = 9.25299
+DELTA    = 0.00465946     FPROUT   = 0              PDITS    = 0
+PDITSL   = 0              PDITSD   = 0              LAMBDA   = 0
+VTL      = 205000         LC       = 0              XN       = 3
+RDSW     = 5082.17        RDSWMIN  = 369.532        RDW      = 100
+RDWMIN   = 0              RSW      = 100            RSWMIN   = 0
+PRWG     = 4.36516        PRWB     = -0.839777      WR       = 1
+ALPHA0   = 0              ALPHA1   = 0              BETA0    = 30
+AGIDL    = 0              BGIDL    = 2.3e+09        CGIDL    = 0.5
+EGIDL    = 0.8            AIGBACC  = 0.43           BIGBACC  = 0.054
+CIGBACC  = 0.075          NIGBACC  = 1              AIGBINV  = 0.35
+BIGBINV  = 0.03           CIGBINV  = 0.006          EIGBINV  = 1.1
+NIGBINV  = 3              AIGC     = 0.0136         BIGC     = 0.00171
+CIGC     = 0.075          DLCIG    = 0              NIGC     = 1
+POXEDGE  = 1              PIGCD    = 1              NTOX     = 1
+TOXREF   = 3e-09          XPART    = 0              CGSO     = 6.19328e-10
+CGDO     = 6.19707e-10    CGSL     = 2.53081e-10    CGDL     = 2.52918e-10
+CKAPPAS  = 0.0255362      CKAPPAD  = 0.0248237      CLC      = 1e-07
+CLE      = 0.6            DLC      = 0              DWC      = 0
+VFBCV    = -1             NOFF     = 1              VOFFCV   = 0.162526
+ACDE     = 1              MOIN     = 15             XRCRG1   = 12
+XRCRG2   = 1              RBPB     = 50             RBPD     = 50
+RBPS     = 50             RBDB     = 50             RBSB     = 50
+GBMIN    = 1e-12          NOIC     = 8.75           EM       = 4.1e+07
+AF       = 1              EF       = 1              KF       = 0
+NTNOI    = 1              TNOIA    = 1.5            TNOIB    = 3.5
+RNOIA    = 0.577          RNOIB    = 0.37           DMCG     = 0
+DMCI     = 0              DMDG     = 0              DMCGT    = 0
+DWJ      = 0              XGW      = 0              XGL      = 0
+XL       = 0              XW       = 0              NGCON    = 1
+IJTHSREV = 0.1            IJTHDREV = 0.1            IJTHSFWD = 0.1
+IJTHDFWD = 0.1            XJBVS    = 1              XJBVD    = 1
+BVS      = 10             BVD      = 10             JSS      = 0.0001
+JSD      = 0.0001         JSWS     = 0              JSWD     = 0
+JSWGS    = 0              JSWGD    = 0              CJS      = 0.0005
+CJD      = 0.0005         MJS      = 0.5            MJD      = 0.5
+MJSWS    = 0.33           MJSWD    = 0.33           CJSWS    = 5e-10
+CJSWD    = 5e-10          CJSWGS   = 5e-10          CJSWGD   = 5e-10
+MJSWGS   = 0.33           MJSWGD   = 0.33           PB       = 1
+PBSWS    = 1              PBSWD    = 1              PBSWGS   = 1
+PBSWGD   = 1              TNOM     = 27             UTE      = -0.623226
+KT1      = -0.660124      KT1L     = 2.02929e-08    KT2      = -0.178646
+UA1      = 1.14212e-09    UB1      = 2.92892e-19    UC1      = -0.0687707
+AT       = 86944.8        PRT      = 9.99937        NJS      = 1
+NJD      = 1              XTIS     = 3              XTID     = 3
+TPB      = 0              TPBSW    = 0              TPBSWG   = 0
+TCJ      = 0              TCJSW    = 0              TCJSWG   = 0
+SAREF    = 1e-06          SBREF    = 1e-06          WLOD     = 0
+KU0      = 0              KVSAT    = 0              TKU0     = 0
+LKU0     = 0              WKU0     = 0              LLODKU0  = 0
+WLODKU0  = 0              KVTH0    = 0              LKVTH0   = 0
+WKVTH0   = 0              LLODVTH  = 0              WLODVTH  = 0
+STK2     = 0              LODK2    = 1              STETA0   = 0
+LODETA0  = 1              WL       = 0              WLN      = 1
+WW       = 0              WWN      = 1              WWL      = 0
+LL       = 0              LLN      = 1              LW       = 0
+LWN      = 1              LWL      = 0              LLC      = 0
+LWC      = 0              LWLC     = 0              WLC      = 0
+WWC      = 0              WWLC     = 0              LMIN     = 0
+LMAX     = 1              WMIN     = 0              WMAX     = 1
+AIGS     = 0.0136         BIGS     = 0.00171        CIGS     = 0.075
+AIGD     = 0.0136         BIGD     = 0.00171        CIGD     = 0.075
+DLCIGD   = 0 )
.ENDL models