003_FFT_vector_plots : Quick FFT of transient waveforms
Requires: SmartSpice & Smartview
Minimum Versions: SMARTSPICE 4.30.5.R + SMARTVIEW 2.34.3.R
The SmartView application allows users to take Transient simulation data and create an FFT plot. This is to see if there are any gross frequency components in the circuit output that require further study.
The way this is done is using SmartSpice to run the simulation and SmartView to do the visulization of results as shown below:
1. Source the input deck (accurate_fft_accurate.in) and it will simulate automatically in SmartSpice.
2. Check the Analysis/vectors created in SmartSpice simulator, there will be a "tran1" and a "fft1" analysis listed.
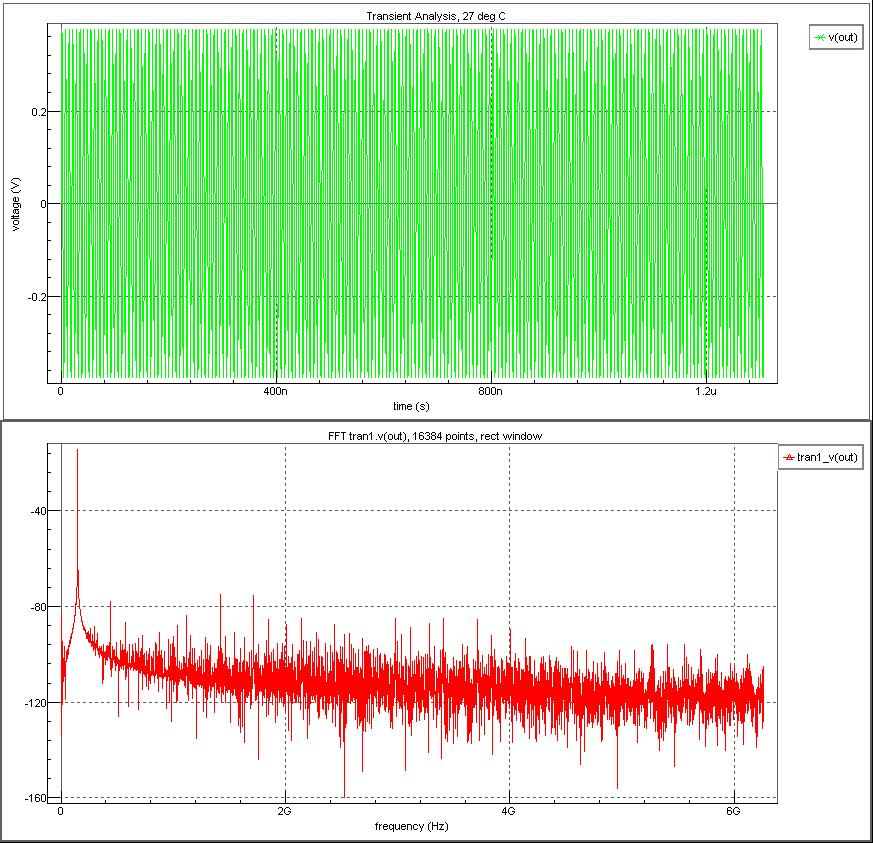
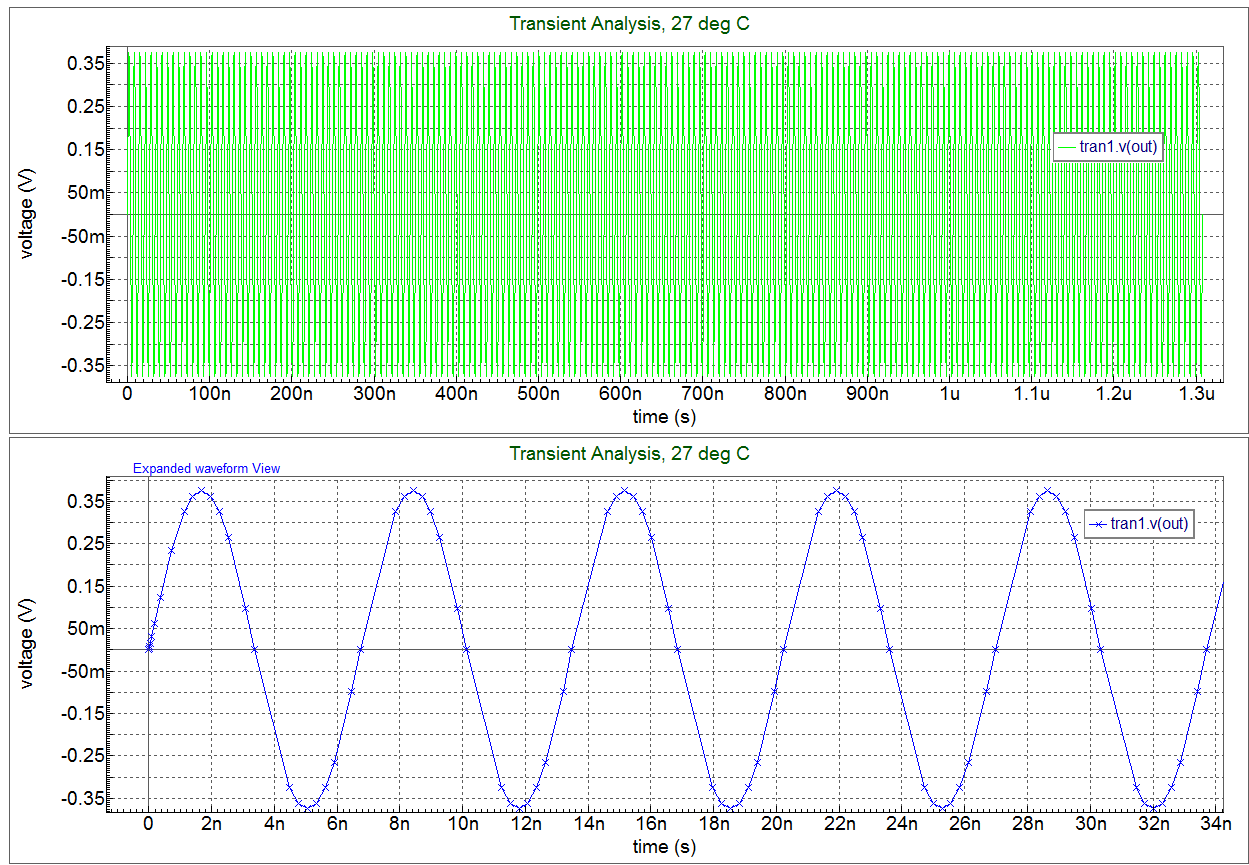
3. If you plot v(out) you will see plot displayed in SmartView.
4. Now use the SmartView toolbar functionality to create the fft plot .
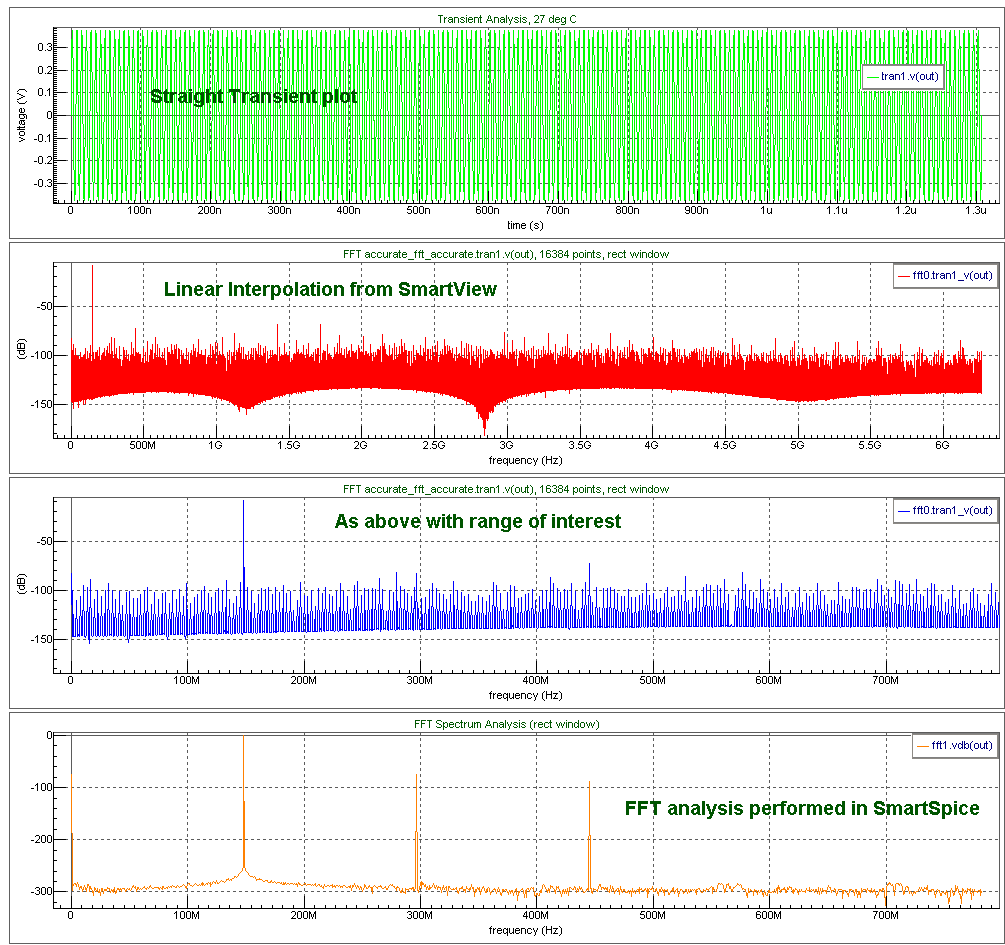
5. If you then take the vector created undet the FFT1 analysis you will get a series of plots displayed.
- Top Transient waveform
- Second FFT linear interpolation from SmartView
- 3rd Restricted to frequency range of interest
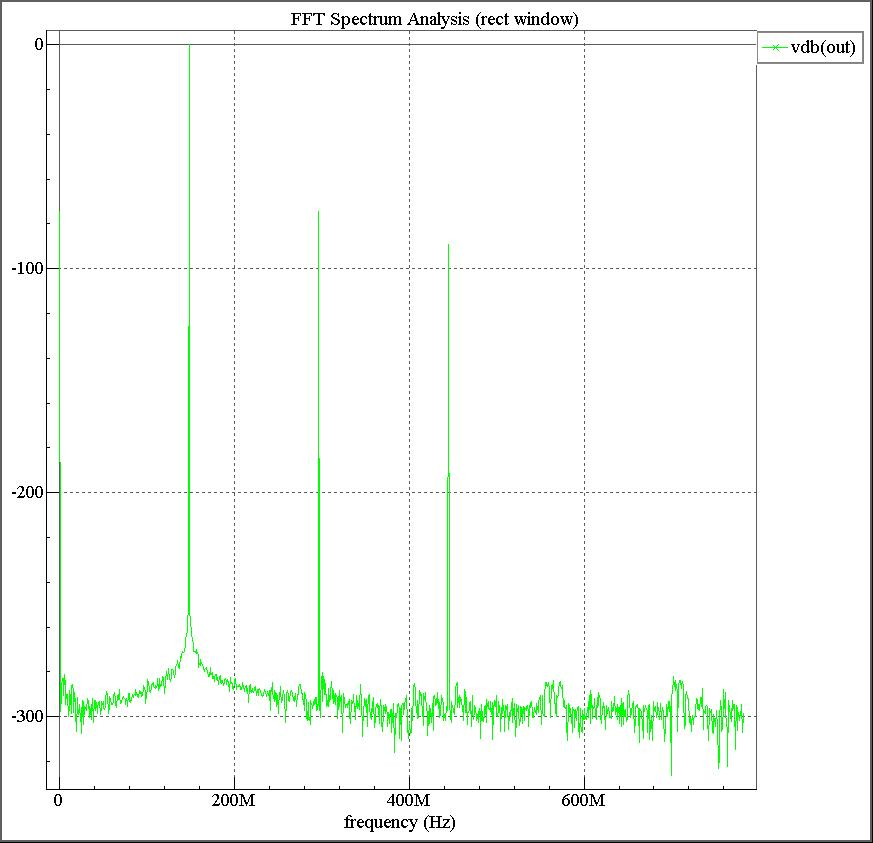
- Straight FFT analysis done in SmartSpice
6. Here is plot where the accurate .FFT simulation has been done in SmartSpice without the interpolation that leads to extra frequency components bing introduced.
NOTE: If you take the transient analysis and create an FFT you will always have extra frequency components introduced due to the linear interpolation required to get a regular time point from a Transient analysis that has irregular time points based on waveform activity. ( FFT is a cyclic analysis that requires a regular time point value input ).
accurate_fft_accurate.in
											****************************************************************************************
*  FFT analysis                                                                        *
*       .Tran vs .FFT (uses .option fft_accurate)                                      *
*  NOTE: if  .option accurate specified then fft_accurate is  turned ON automatically  *
****************************************************************************************cs

.option  reltol=1e-12  abstol=1e-12 hmin=1.1e-12  post  method =gear
*.option post=2

*.param  NBPT=1024
*.param  F_IN=148341809
*.param  FS=1566000128

.param  NBPT=2048
.param  F_IN=148341809
.param  FS=1566000128

Vin  IN 0 DC  0  AC 0  sin(0 0.375   F_IN)
R_IN    IN   0   1K

.param  A0=0  A1=1  A2=0.001   A3=0.001
E_OUT   OUT  0   poly(1)  IN   0  A0  A1  A2  A3
R_OUT   OUT 0  1K

.param  T_DELAY_FFT=0
.param  T_START=T_DELAY_FFT
.param  T_STOP='T_START+((NBPT)/FS)'
.param  T_FS_PERIODE='1/FS'

.tran   T_FS_PERIODE   T_STOP

.fft  v(out)  v(in)   from=T_START   to=T_STOP  np  = NBPT   FORMAT=NORM  WINDOW=RECT

.probe   tran  v(OUT)  v(IN)
.probe  fft  vdb(out)  vdb(in)
.probe all(v)
*.let fft  out_vdb=vdb(out)
**.option fft_accurate

.control
  run batchprint
.endc

.end