002_vector_plots : Plotting of Simulation waveforms
Requires: SmartSpice & Smartview
Minimum Versions: SMARTSPICE 4.30.5.R + SMARTVIEW 2.34.3.R
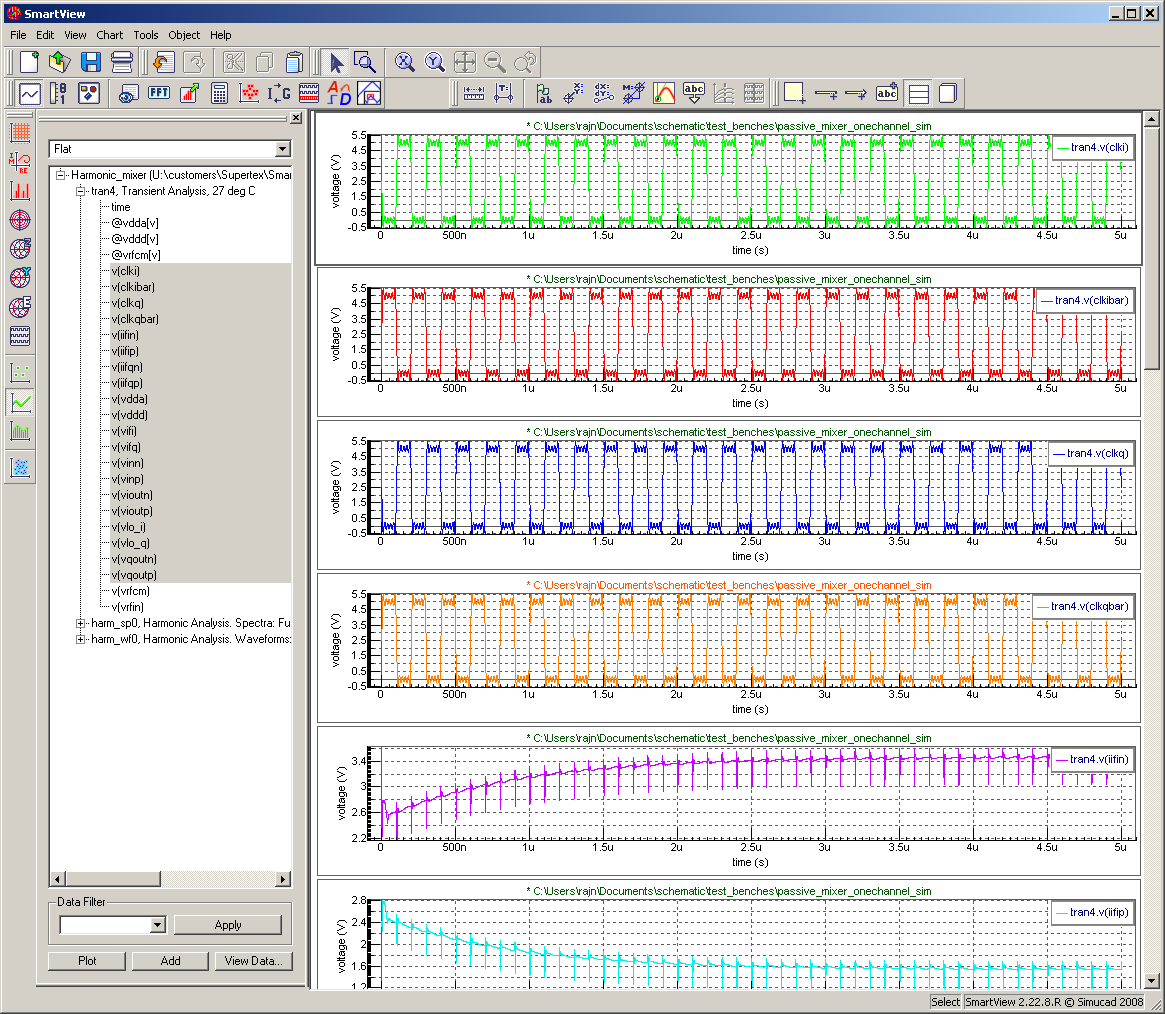
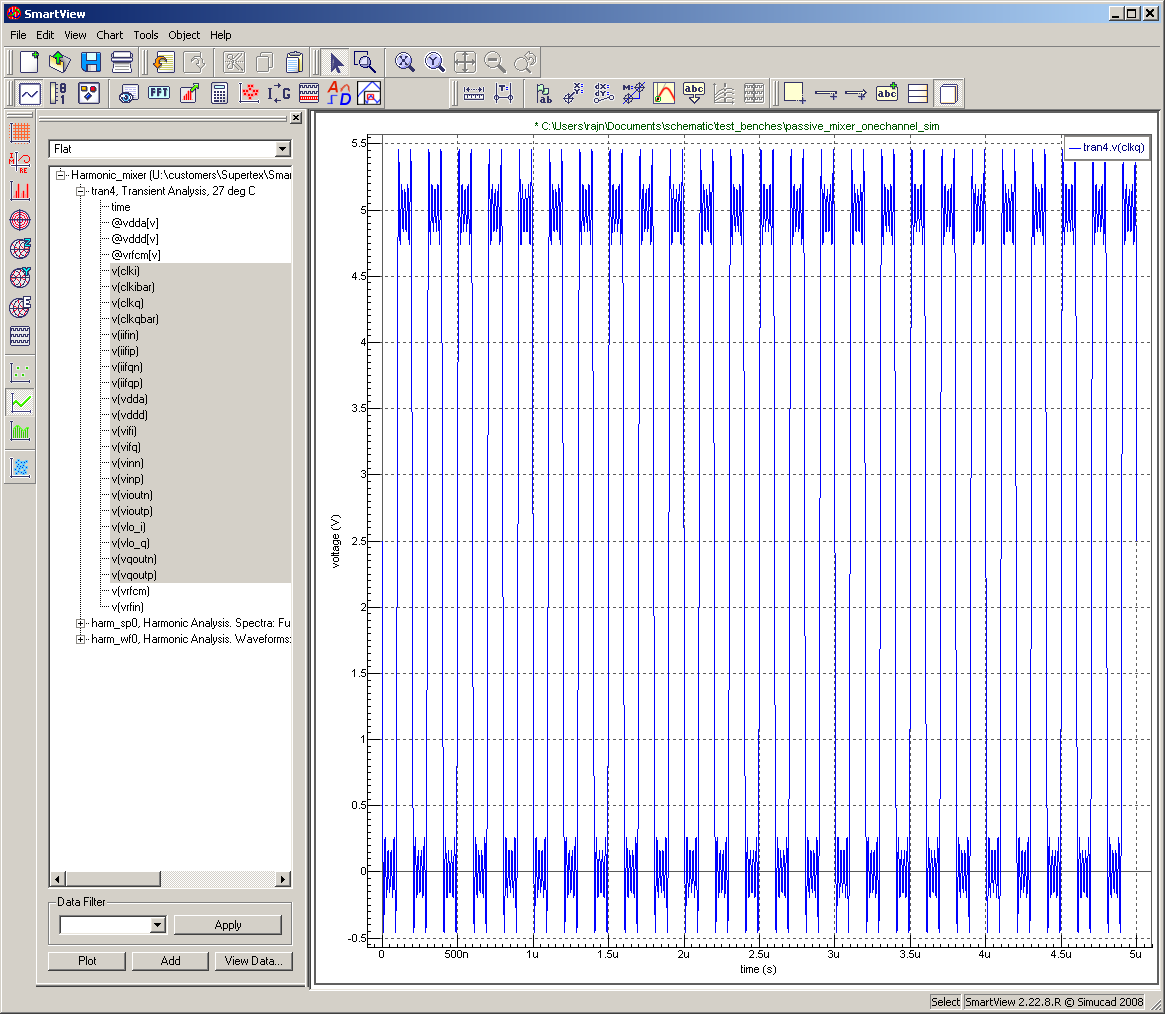
The SmartView application allows users to visualize simulation data. SmartSpice provides 2 options to use SmartView. User can use special statement .IPLOT to see simulation results in real-time.
1. Run SmartSpice application
2. Open netlistand run the simulation
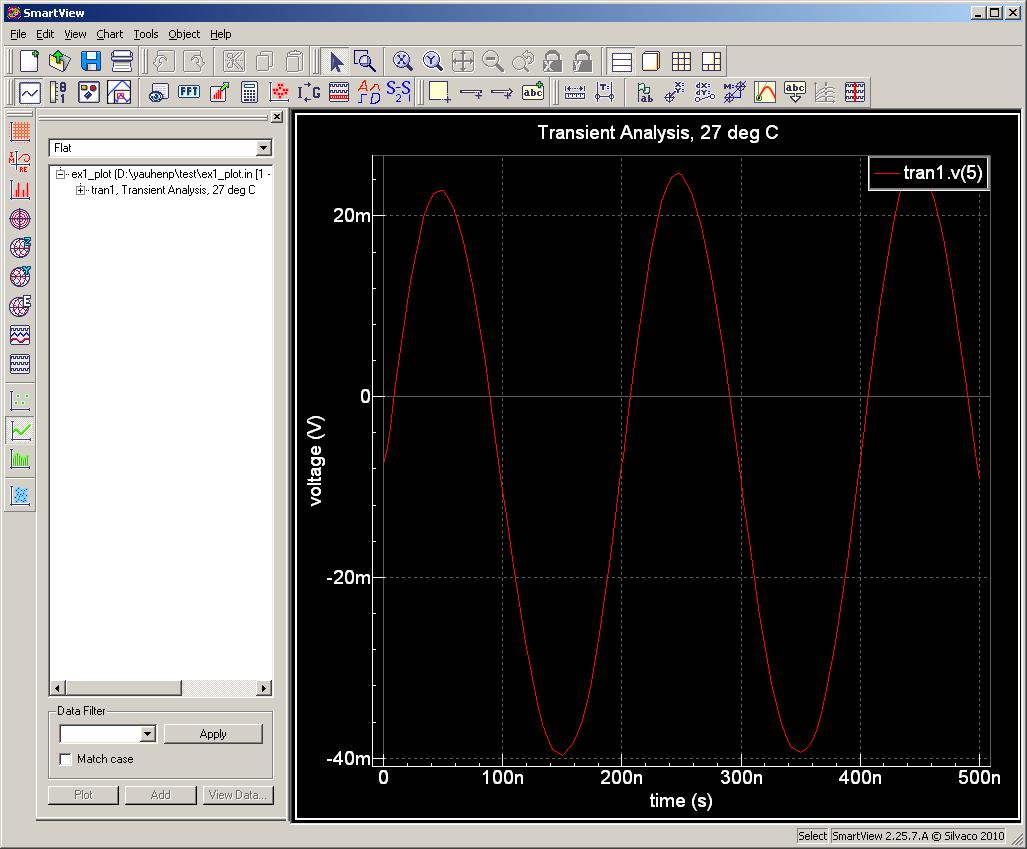
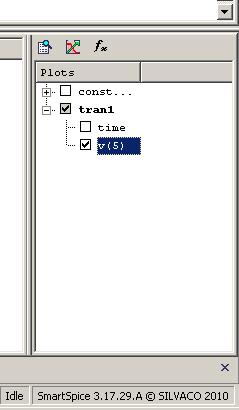
3. SmartView application will start and plot V(5) vector graph
4. To change vector selection the user has to list new vectors in the .IPLOT statement
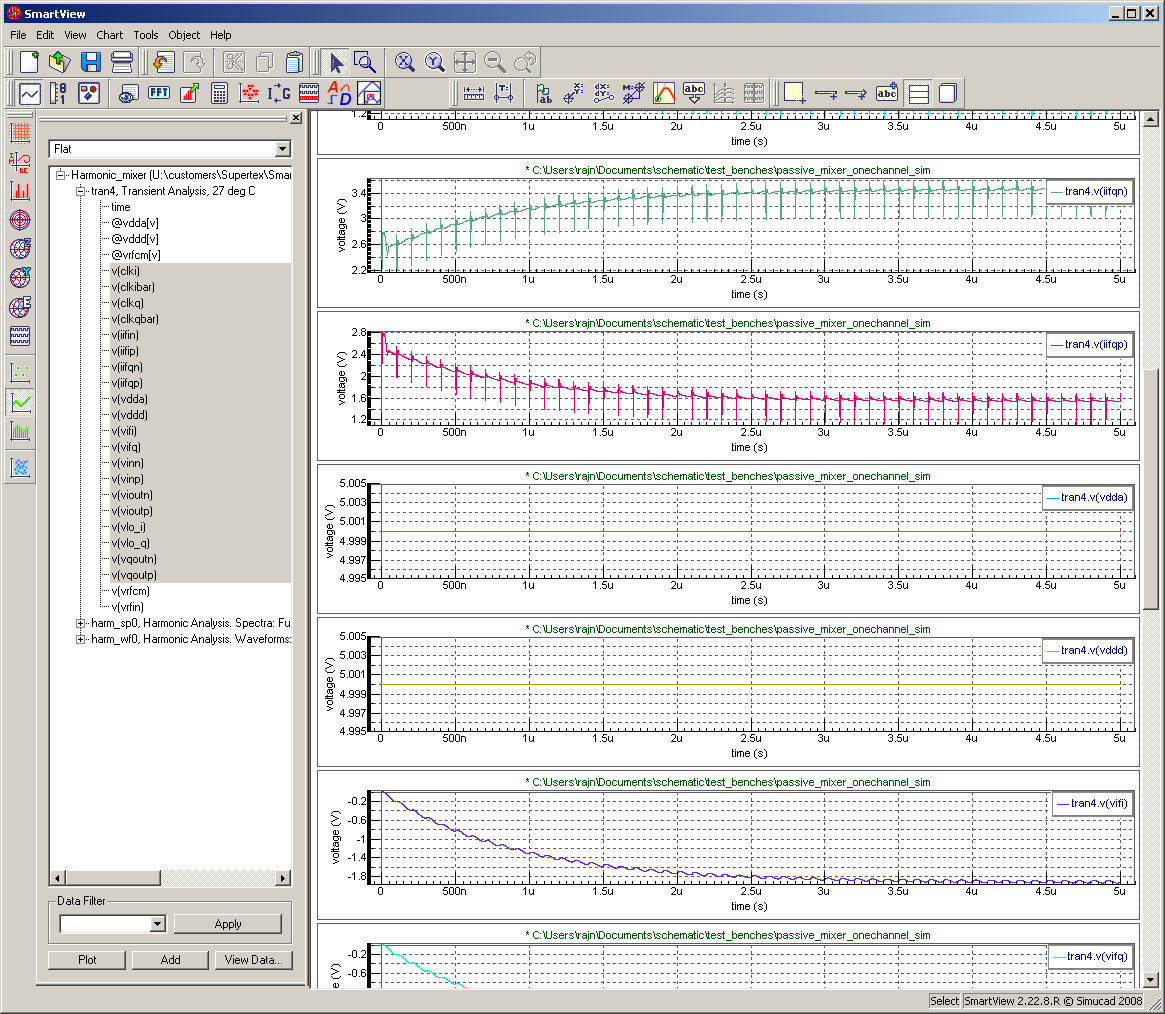
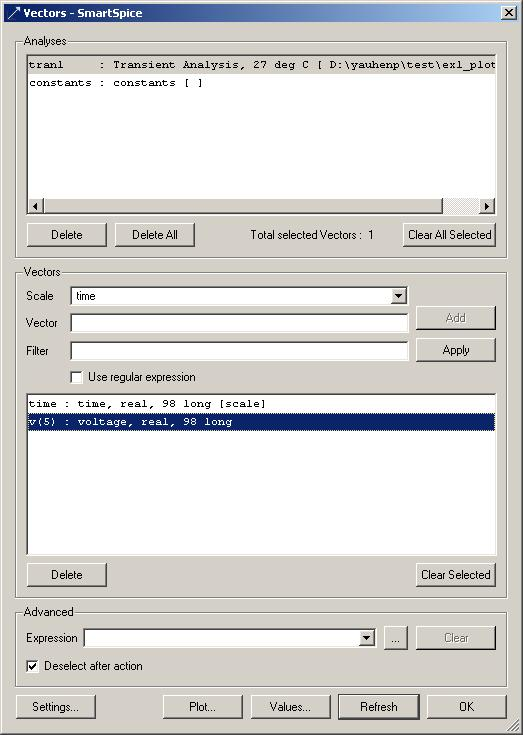
More information about .IPLOT statement could be found in Users Manual vol. 1, Chapter 2. User has the ability to manually select certain vectors after simulation to plot in SmartView without changing the deck. The easiest way to check the vectors is in "Vector" window (usually displays in right-bottom corner of the main window) and press the "Plot" button. The second way is to open "Vectors" dialog (View -> Vectors), select required simulation(s) in the upper list, select required data vectors in the lower list, and press the "Plot" button. The selected vectors will be displayed in SmartView.
The input deck is a SPICE file containing .................
To run the simulation, press the run button. When the simulation completes, the resulting picture are shown in SmartView for postprocessing. picture 1 picture 2
ex1_plot.in
											*     SMARTVIEW DEMO EXAMPLE
*

*********************************************
* Netlist
VIN  1 0  DC 0  SIN(0 0.1 5MEG)  AC 1
VCC  8 0  DC 10
VEE  9 0  DC -12
RS1  1 2  1K
RS2  5 0  1K
RC1  3 8  10K
RC2  4 8  10K
RBIAS  7 8  20K
CLOAD  3 4  5PF
Q1  3 2 6  QNL
Q2  4 5 6  QNL
Q3  6 7 9  QNL
Q4  7 7 9  QNL
*********************************************

*********************************************
* Model definition
.MODEL QNL NPN(BF=80 RB=100 CCS=2PF TF=0.3NS TR=6NS CJE=3PF CJC=2PF
+   VA=50)
*********************************************

.TRAN 5NS 500NS

*********************************************
* To plot more vectors list them in this statement
.IPLOT V(5)
*********************************************

.OPTIONS ACCT RELTOL=0.001 NOMOD NODECK
.END