Liberty File Analysis & Validation
Overview
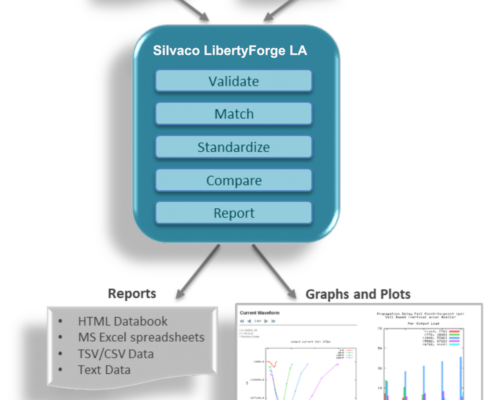
LibertyForge LA™ displays, analyzes, compares, and validates Liberty™ files for timing, power, noise, and area. LibertyForge LA handles multiple NLDM, NLPM, CCS, ECSM, and LVF models at library, cell, pin, and individual arc levels while providing insightful statistical data. It displays and plots relative and absolute differences with user-settable thresholds for easy spotting of trends and outliers. Its validation routines include sanity checks that validate libraries for use with any design flow.
Silvaco LibertyForge LA reads Liberty (.lib) files produced by any tool or captive characterization flow and helps assess the performance of different libraries.
Key Features and Benefits
- Extracts functional, timing, power, noise and area data from multiple libraries, helping to identify each library’s weakest points
- Fosters in-depth analysis of characterization results, using a single library or by direct comparison against a reference library, to identify cells that are too slow or consume too much power. Analysis readily shows the best and worst arc, pin and transition/load pair
- Facilitates comparison of libraries processed with different characterization tools or different SPICE engines; summarizes characterization data for quick analysis of characterization results
- Validates Liberty files for use in third-party design flows, or as input to synthesis and (S)STA tools
- Verifies linearity and completeness across logical families and drive strength variants for any group of cells
- Spots potential electromigration and maximum capacitance/transition violations based on characterization results
- Conveniently converts CCS or ECSM libraries to NLDM format for easier comparison and analysis
- Comparison of timing distributions from variation-aware LVF libraries with a configurable sigma target, including support for LVF Moments
Decisions
- Compares library-to-library, cell-to-cell, pin-to-pin, arc-to-arc timing and power
- Accurately displays both absolute and relative differences in area, timing, power and noise between multiple libraries encoded in different modeling formats
- Automatically compares cells within logical families and ensures that libraries respect constraints
- Merges and exports Liberty files containing experimental values, reduced sets of cells or using different characterization models
- Selects, matches, interpolates and normalizes for comparing measurement types, table sizes, index ranges, input transitions, input stimuli, and state-dependent vs. worst-case measurements
- Derives useful metrics such as data to output delay, full-cycle power, timing variation distribution, metastability windows, quality of results etc.
- Comparisons include profiling graphs and statistics
- Traceability back to original data enables identifying outliers in the Liberty file
2D and 3D Plots and Graphs
- Provides 2D and 3D plots of library performance criteria of selected lookup table (LUT) data for timing and power, including CCS and ECSM waveform plots
- Plots absolute and relative deviations with insightful statistics over these values
- Graphs CCS current waveforms with resulting voltage waveforms
Library Differences Highlighted
- Outputs spreadsheets with trend plots showing point-to-point deviation across all arcs
- Produces deviation reports with traceability back to original data
- Compare NLDM, NLPM, CCS, ECSM, and LVF data (including Moments) with focus on performance or correlation between libraries
- Highlights differences with user-settable thresholds for easy identification of matching cells, completeness, and performance outliers in absolute or relative terms
Inputs
- Liberty library model files including NLDM, NLPM, CCS, ECSM, LVF, and LVF Moments extensions
- Optional configuration file for custom analysis of specific cells, measurements, statistics, plots, deviation thresholds and formatting
Outputs
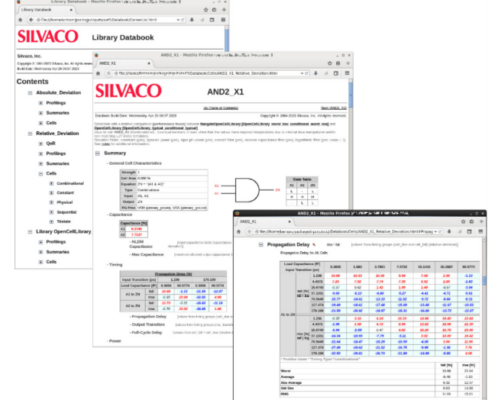
- HTML databook with hierarchical hyperlinked navigation to cells, pins, arcs, reports, and statistical data
- MS Excel sheets containing correlation data and plots for all arcs
- Human readable text PDF format and CSV/TSV raw data for export
- Plotted data in PNG plot format for 2D and 3D color plots
- Liberty files when pruning or merging
Hierarchical Databook
- Hierarchical HTML databook clearly displays Liberty data for easy understanding using any HTML browser
- User-friendly click-through main page descends hierarchy to cell pages, summary pages, group pages, profiling plots – all with traceability to original data


