A Sophisticated Verilog-A Debugger
During the elaboration of a Verilog-A model, debugging a module can be very useful for detecting non-physical behavior or fine-tuning the model. The SILVACO Verilog-A debugger has been designed to meet these needs. It is available since version 2.6.0.R of SmartSpice and works along with SILVACO C-Interpreter. It allows iteration-per-iteration Verilog-A modules debugging. The debugger is tracing all the Verilog-A instantiations of the design, either instances of the SmartSpice netlist or in other Verilog-A modules.
The BSIM4 Verilog-A model (bsim4.va) and the adder design (adder.in) used as an example are freely available on SILVACO website.
It can be enabled by setting in the input deck:
.OPTIONS va_mode=debug
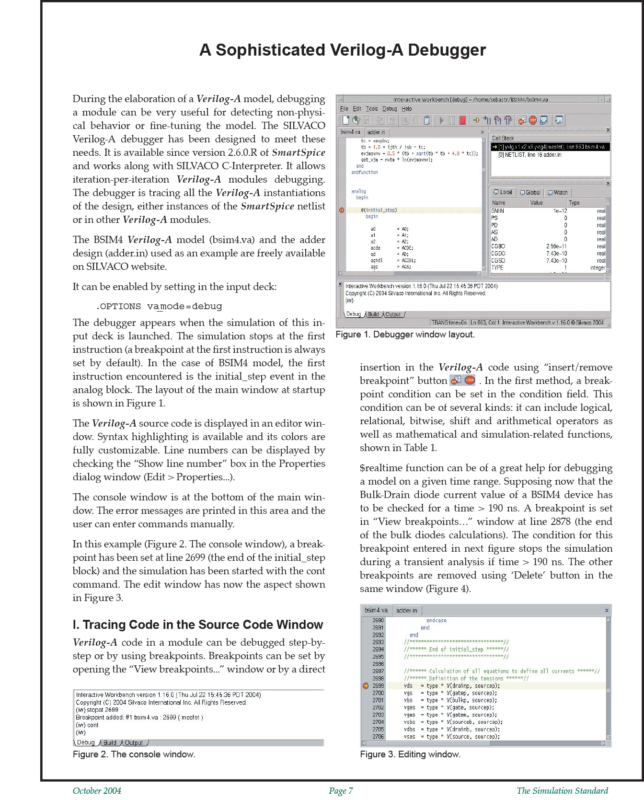
The debugger appears when the simulation of this input deck is launched. The simulation stops at the first instruction (a breakpoint at the first instruction is always set by default). In the case of BSIM4 model, the first instruction encountered is the initial_step event in the analog block. The layout of the main window at startup
The Verilog-A source code is displayed in an editor window. Syntax highlighting is available and its colors are fully customizable. Line numbers can be displayed by checking the “Show line number” box in the Properties dialog window (Edit > Properties…).
The console window is at the bottom of the main window. The error messages are printed in this area and the user can enter commands manually.
In this example (Figure 2. The console window), a breakpoint has been set at line 2699 (the end of the initial_step block) and the simulation has been started with the cont command. The edit window has now the aspect.


