QUEST: Frequency-Dependent RLCG Extractor Part 2 – Comparison with Experiments
Part 2 – Comparison with Experiments
Introduction
This article presents a standard case of transmission line: the microstrip structure. First, the structure is described and then the results extracted from QUEST are compared with measurements. We thank STMicroelectronics (Crolles-R&D) for experimental data support.

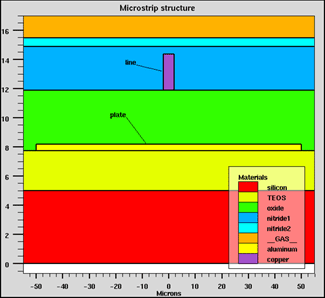
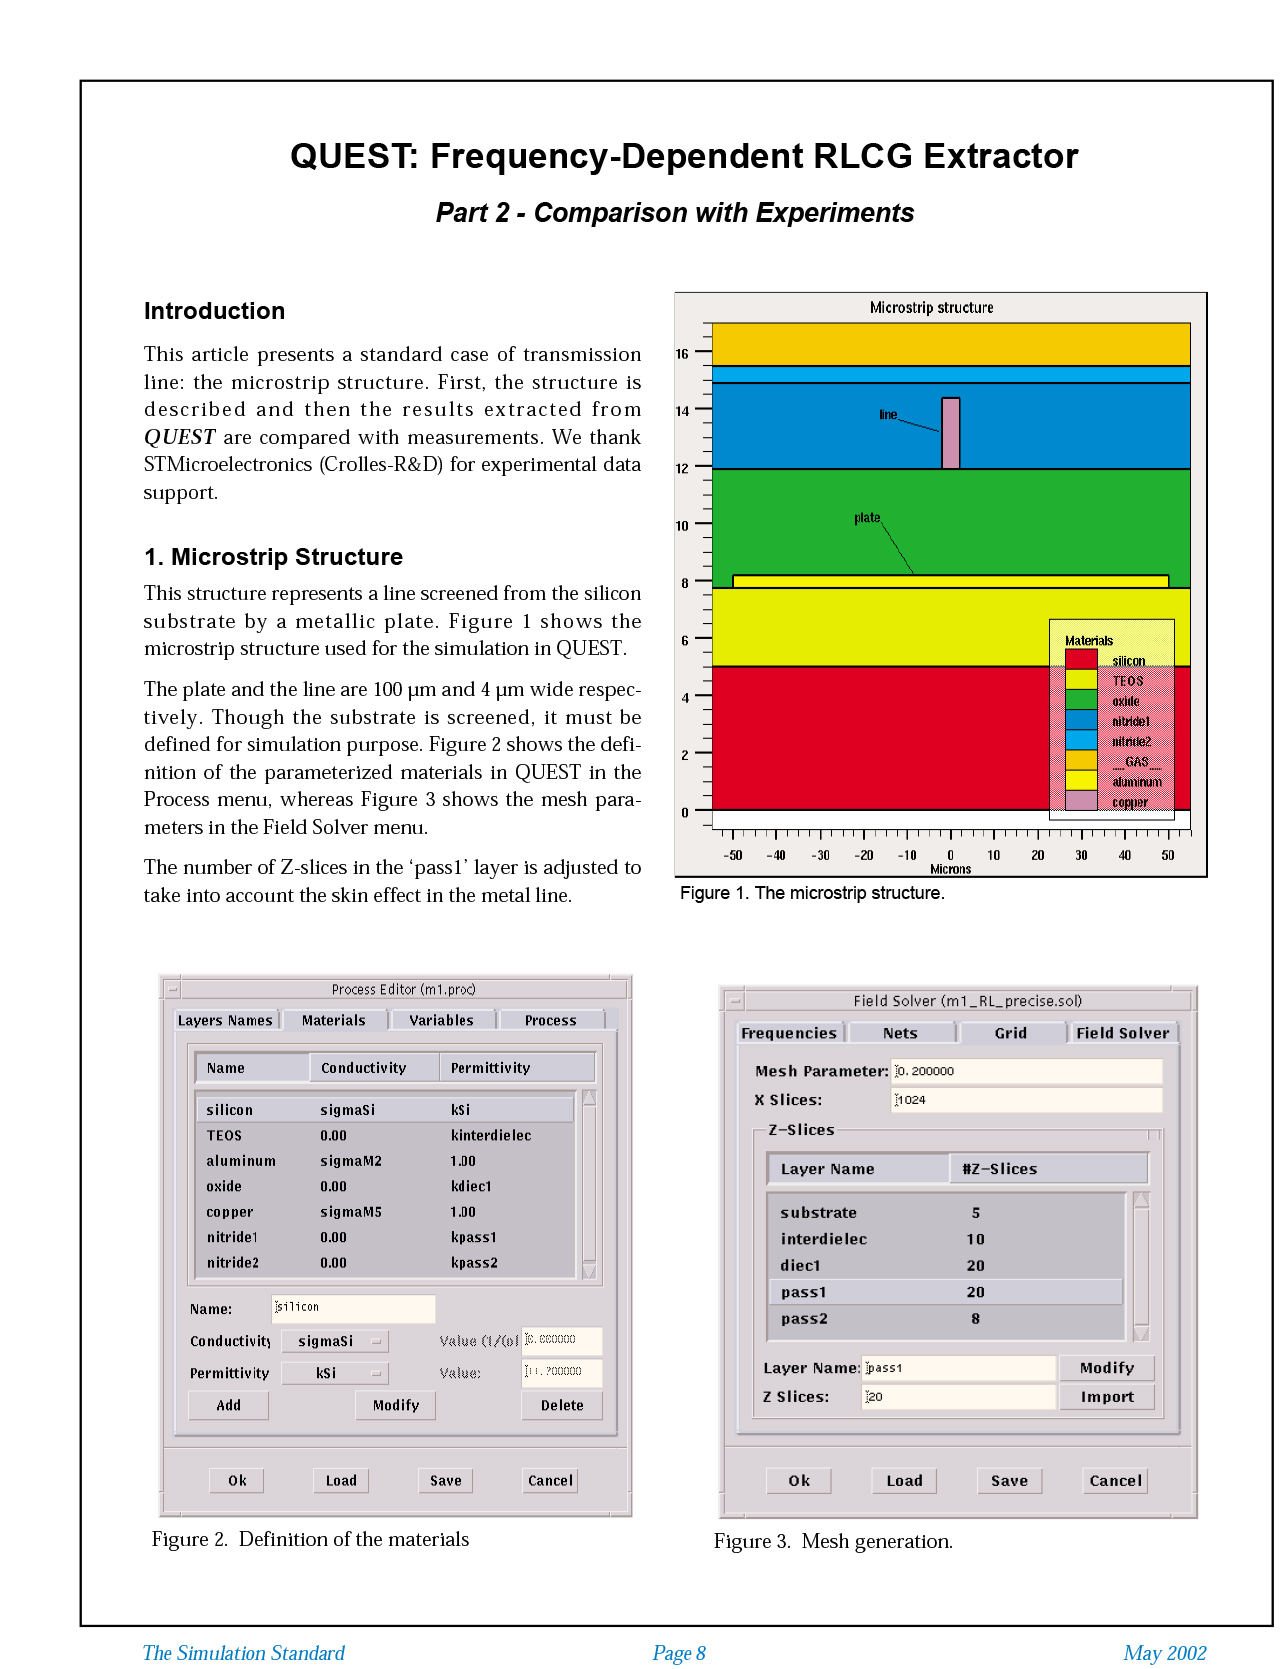
Figure 1. The microstrip structure
1. Microstrip Structure
This structure represents a line screened from the silicon substrate by a metallic plate. Figure 1 shows the microstrip structure used for the simulation in QUEST.
The plate and the line are 100 ?m and 4 ?m wide respectively. Though the substrate is screened, it must be defined for simulation purpose. Figure 2 shows the definition of the parameterized materials in QUEST in the Process menu, whereas Figure 3 shows the mesh parameters in the Field Solver menu.
The number of Z-slices in the ‘pass1’ layer is adjusted to take into account the skin effect in the metal line.
2. Results
In order to compare simulated results with measurements, attention should be paid on the current return path. In QUEST, the reference is the substrate by default whereas the experiments have been performed in such a way that the reference is the plate. The default in QUEST has to be changed by selecting a flag setting the plate as the reference for the current return path.


